11 Minutes

A Conversational Analytics Exploration: Ed Sheeran vs Luis Fonsi in 2017
Conversational Analytics on a Streaming Music Dataset
2017 was quite a year in music. We had several massively popular songs come out from Adele’s Hello to the Chainsmokers’ Closer. There were new albums from Drake, Kendrick Lamar, Shawn Mendes, and several others. In my family, though, even looking back, there were two that stood out : Ed Sheeran who came out with Shape of You, and Luis Fonsi with Despacito. It seemed like you couldn’t go anywhere without hearing one or both of these songs. So, which artist / song was actually more popular in 2017?
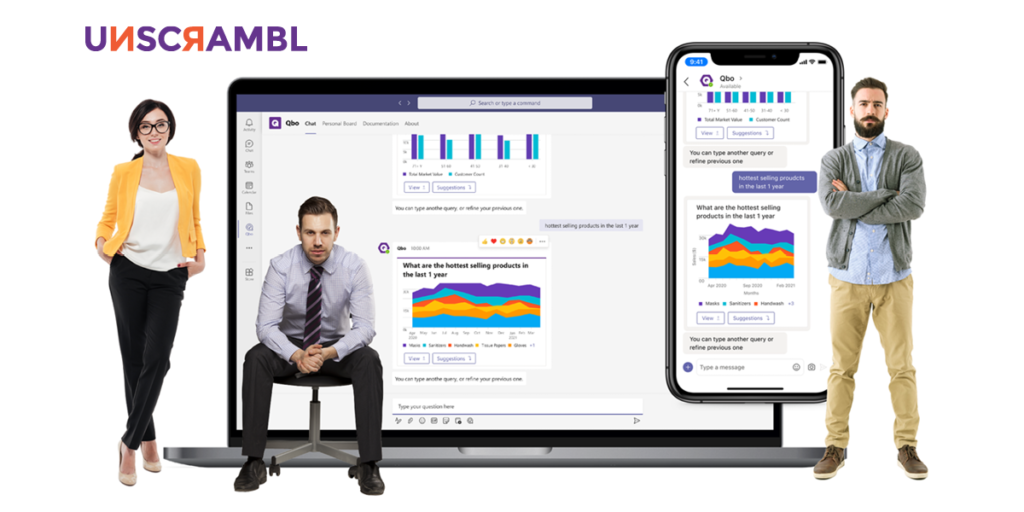
Let’s try to answer this question with data. One relevant dataset to answer this question comes from Spotify. In this article, we are going to explore the Spotify dataset from Kaggle website using Qbo and conversational analytics. Specifically, we shall show how conversational analytics can help answer interesting questions on datasets in an easy manner. We believe this paradigm can dramatically transform the way people interact with data, and give them more power to analyze data and come up with their own conclusions.
Spotify Data Exploration using Qbo
Spotify is one of the most popular music streaming services. This dataset contains the daily ranking of the 200 most listened songs in 53 countries from 2017 and 2018 by Spotify users. It contains more than 2 million rows, which comprises 6629 artists and 18598 songs. The data spans from 1st January 2017 to 9th January 2018 and was collected from Spotify’s regional chart data.
We will cover how the data source is set up inside Qbo. This includes configuring the data source; i.e. defining entities, attributes, data types, synonyms and other concepts. We will then do some basic sanity checks on the data and get familiar with the content of the data. Finally, we will explore and derive insights using Qbo’s chat interface enabling us with Natural Language.
With the help of Augmented Intelligence provided by Qbo, the dataset allows us to explore how artists and songs’ popularity varies in time. For example, how long do various songs stay in the top rankings; what were the most popular songs in different countries; are there songs popular across countries, etc.
Data Source Setup
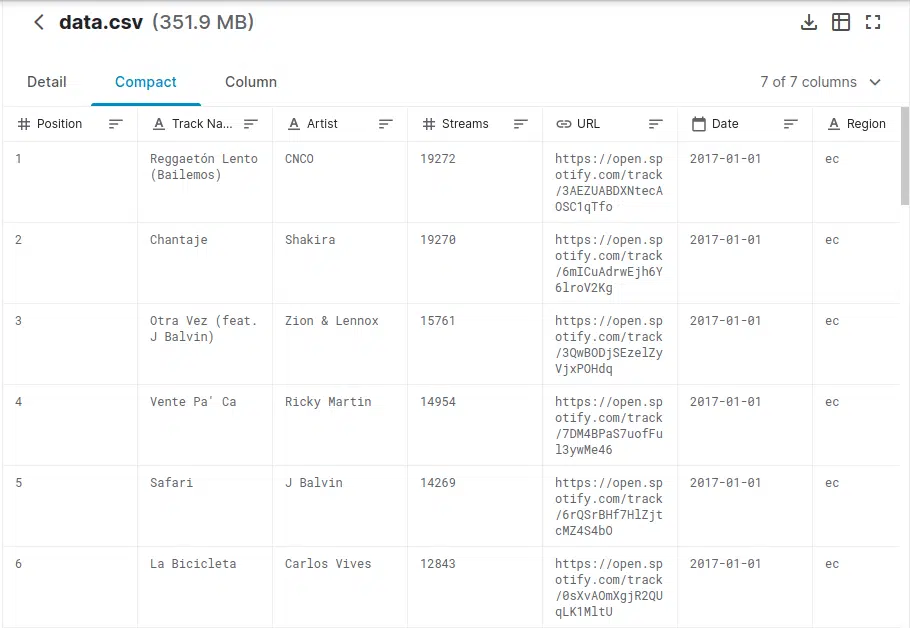
The first step is to download the data here. A few sample rows of the dataset are shown below:
 Qbo support a lot of ways to connect to data:
(1) it can connect to a database directly,
(2) connect to an application or service on the cloud, and even
(3) via file upload using the UI interface directly.
It has support for a wide array of database types. For this example, we will use a MariaDB instance to store the data and have Qbo connect to this MariaDB instance.
We also enriched the Spotify dataset with the actual country names(Region Name) instead of the country codes using the country ISO codes.
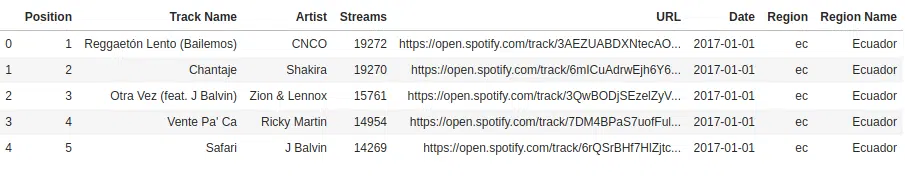
This is the final metadata information, with the data types of each column of our table in MariaDB:
CREATE TABLE `tracks` (
`index` bigint(20) DEFAULT NULL,
`Position` bigint(20) DEFAULT NULL,
`Track Name` text,
`Artist` text,
`Streams` bigint(20) DEFAULT NULL,
`URL` text,
`Date` datetime DEFAULT NULL,
`Region` text,
`Region Name` text,
KEY `ix_tracks_index` (`index`)
) ENGINE=InnoDB DEFAULT CHARSET=utf8mb4
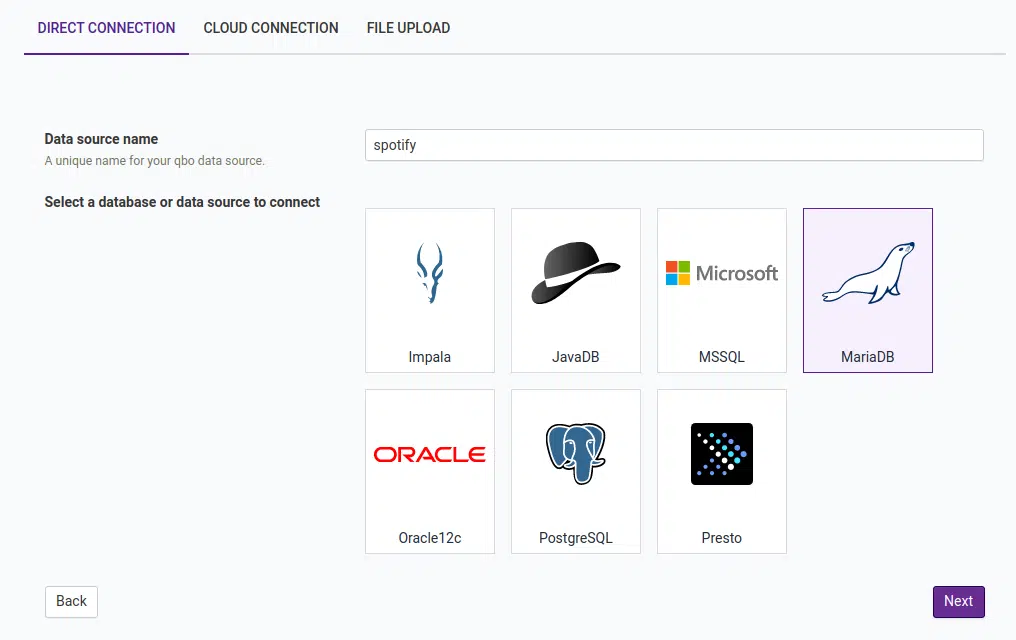
After creating the database containing the Spotify data and loading the data, we will set up the Qbo data source connection for some helpful augmented analytics in hand. After you log in as admin, go to the Data Sources section, add a new data source and select MariaDB.
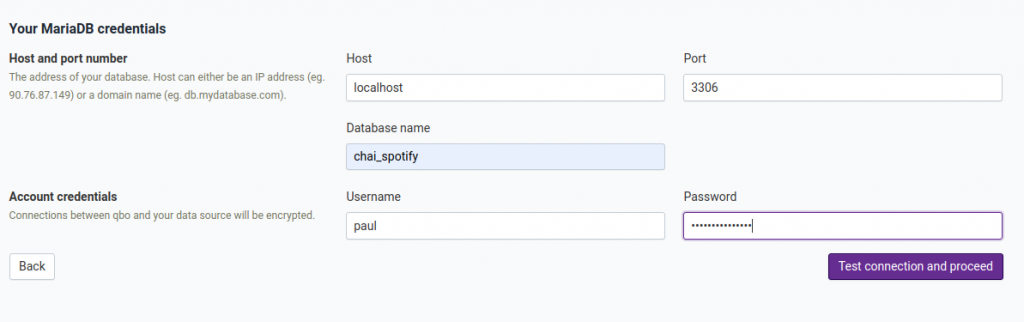
Fill in the necessary credential details of the database. Here, the name of the database we created is called `chai_spotify` in our local machine.
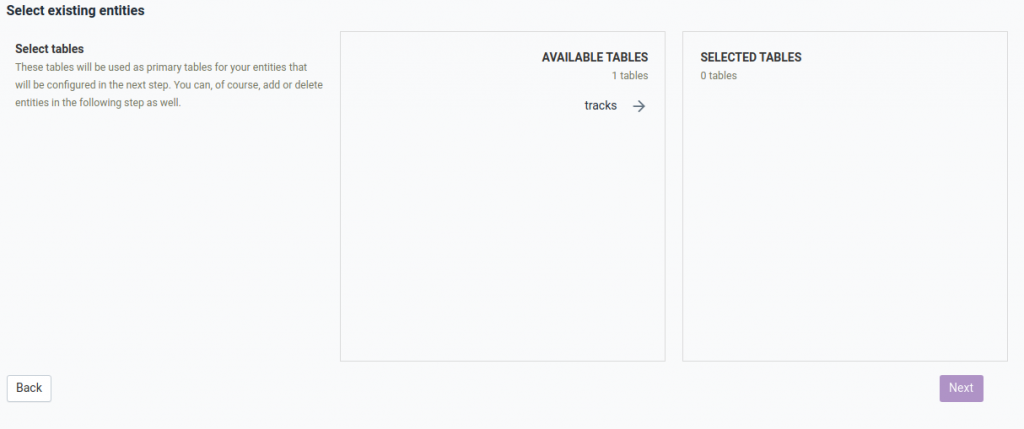
In the next section, all the tables inside the database will be shown for our next process, we need to indicate which of the tables are we going to connect. In this case, our database `chai_spotify` has only one table/entity called `tracks` which contain the data we downloaded from Kaggle website.
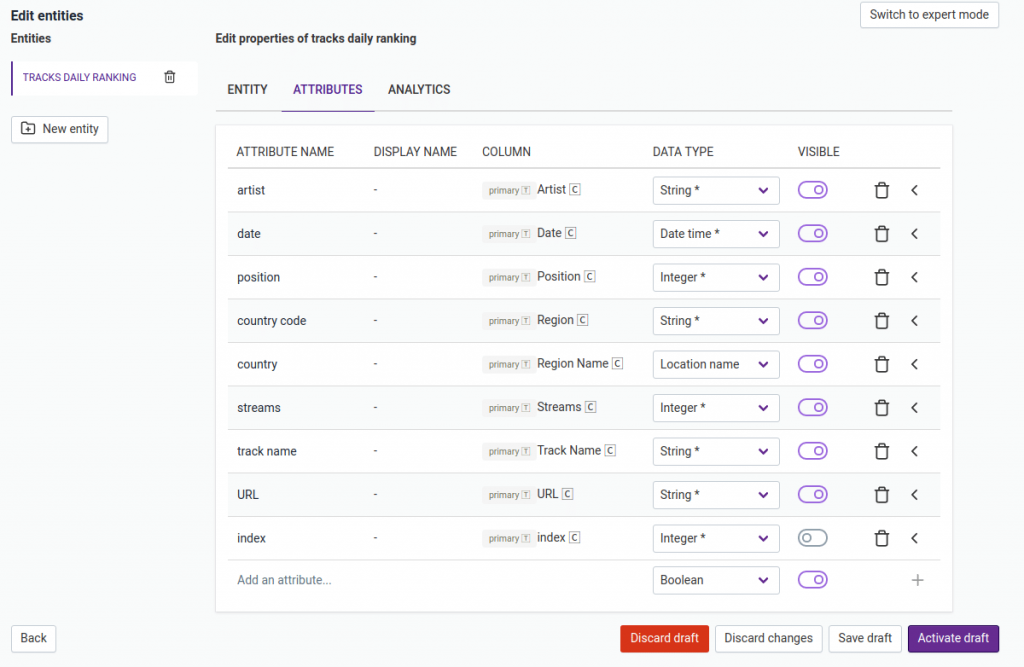
After this, we can start with setting up additional details about our table/entity. Here we can rename the table, specify what kind it is, which attributes to use for ordering, which attribute to use by default for temporal queries, what are the primary keys, etc. For more details about how to set up, see the documentation.
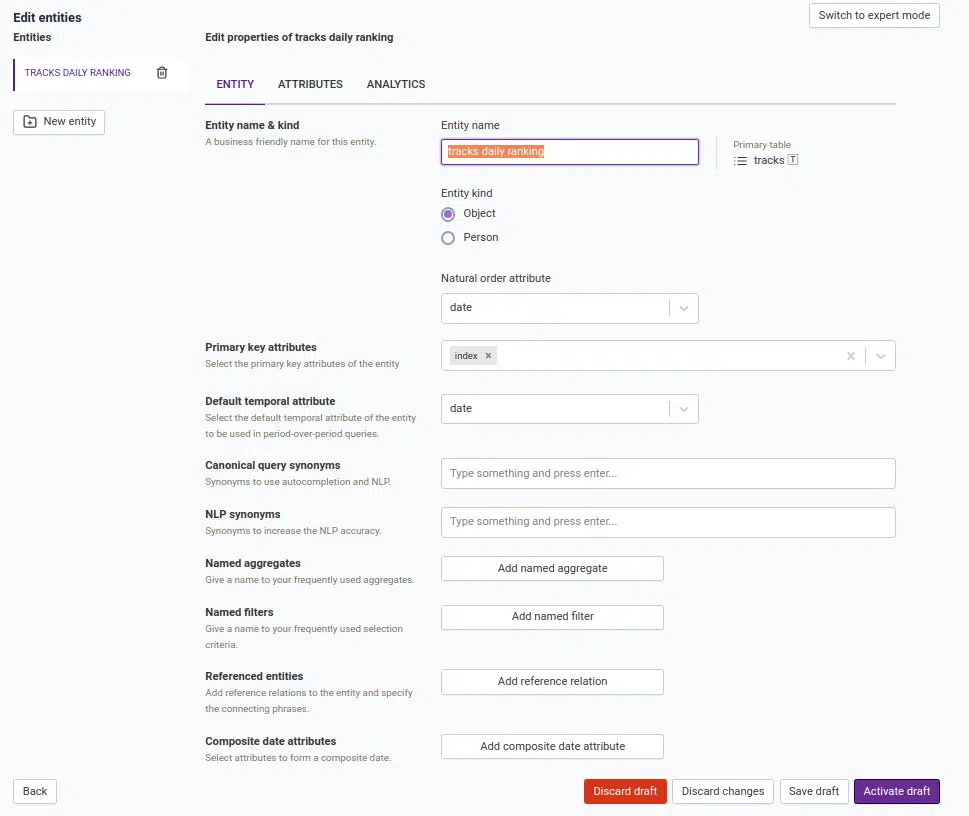
Let’s begin getting information about our data. For this example, we will just cover the basic setup for the data types for each column of the table and make sure they are configured correctly. Qbo picks up the datatype of each column as indicated in the original table by default, but to make sure, let’s double check the data types. Here, we changed the attribute names for some of the columns of the table according to how we want them to appear in the Qbo chat interface. Also, we changed Region Name’s data type from `String` to `Location name`. This will enable map options in the visualization.
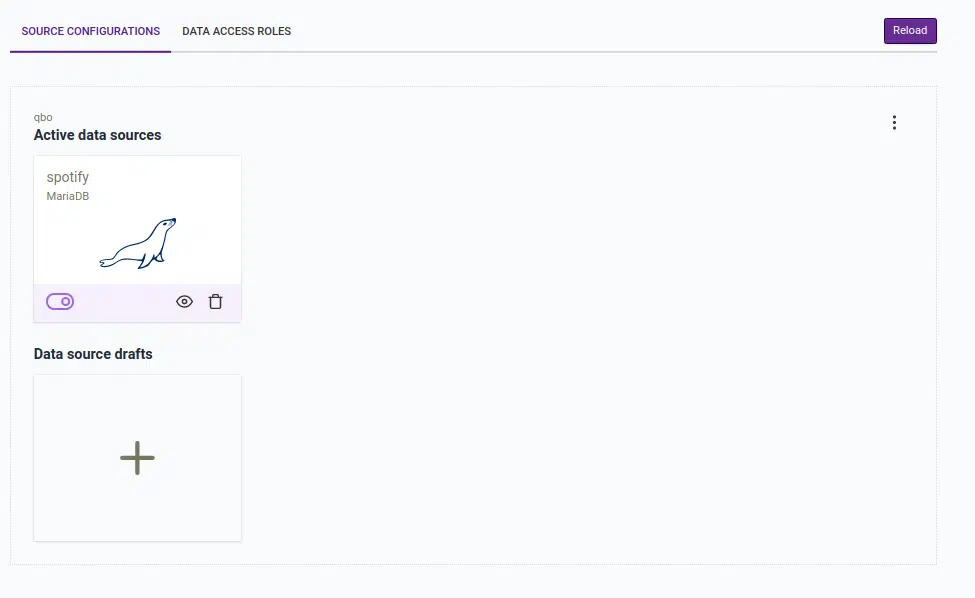
After doing the necessary configurations, make sure to save and activate the data source draft. The newly setup data source will be shown in the main page of Data Sources section as shown below. Also, here make sure to press reload and you are good to go!
 Basic Data Sanity Check and Data Familiarity
 Basic Data Sanity Check and Data Familiarity
Before using Qbo for data exploration and deriving insights, it is important to make sure that the data is configured correctly inside Qbo. This will provide confidence that we are processing the right data and also a good starting point to get familiar with the content of the data. To access conversational analytics, we use Qbo’s chat interface directly to ask simple questions for data validation.
First, let’s get to know the data and show some sample rows and columns. Entering the table name in the chat box is enough.
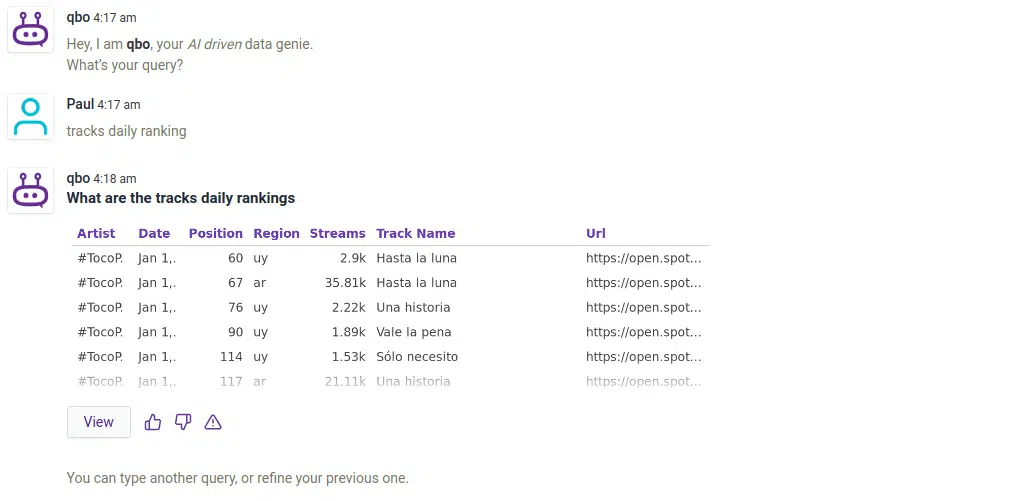
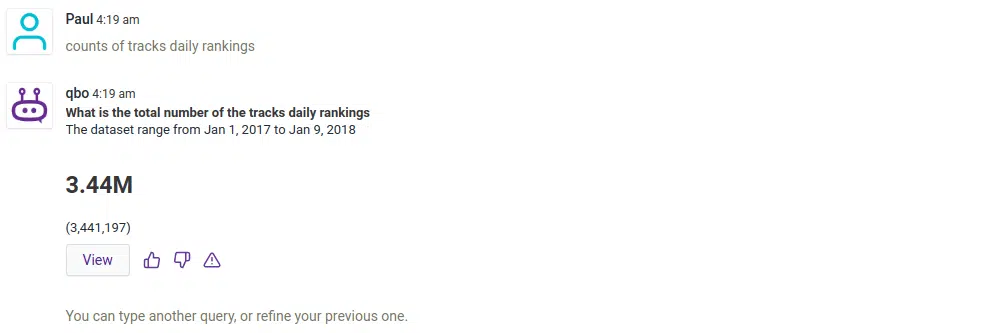
There is a total of 3 million rows in the table. Also, a side note, the NLP feature of Qbo allows it to understand users’ questions that may be phrased in different ways. Users can also use the autocompletions to construct the questions.
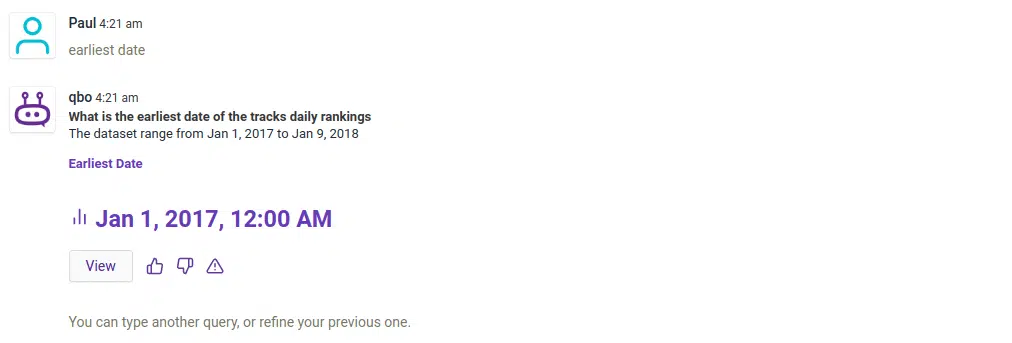
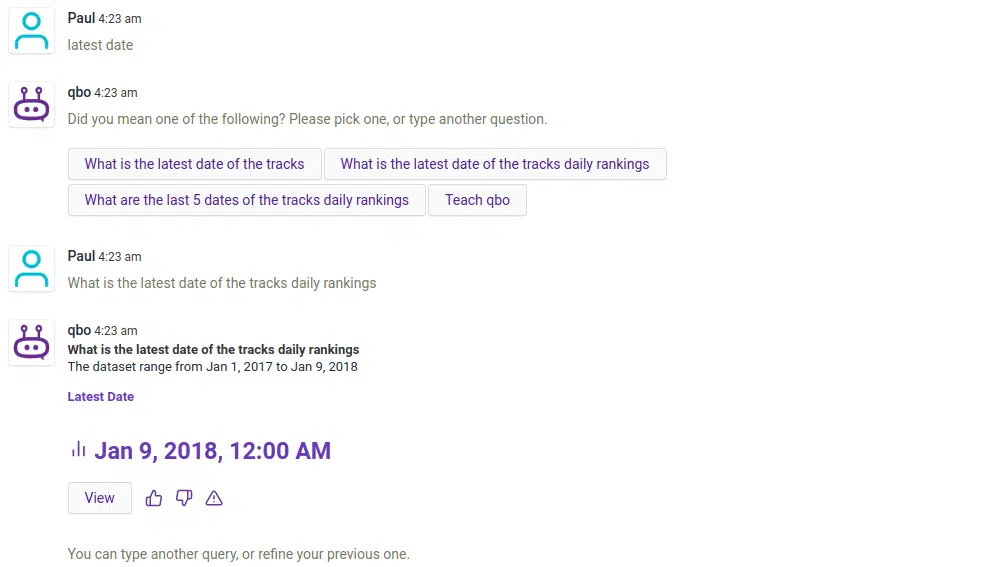
Next, let’s verify the date range of the data. We have at least a year’s worth of data.
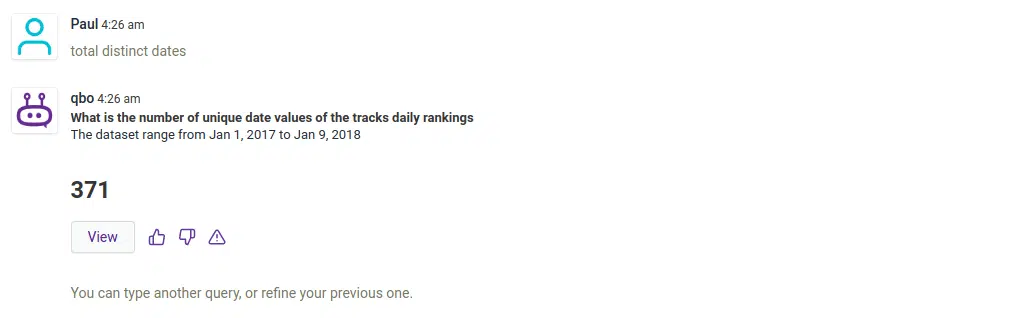
Let’s confirm that. 371 days seems enough!
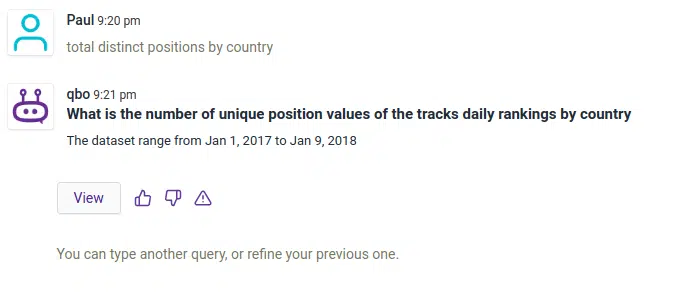
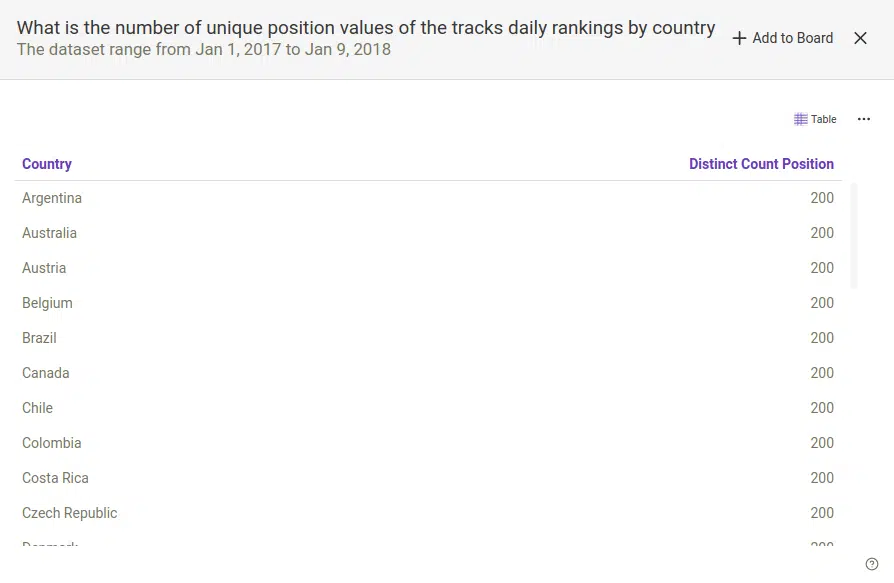
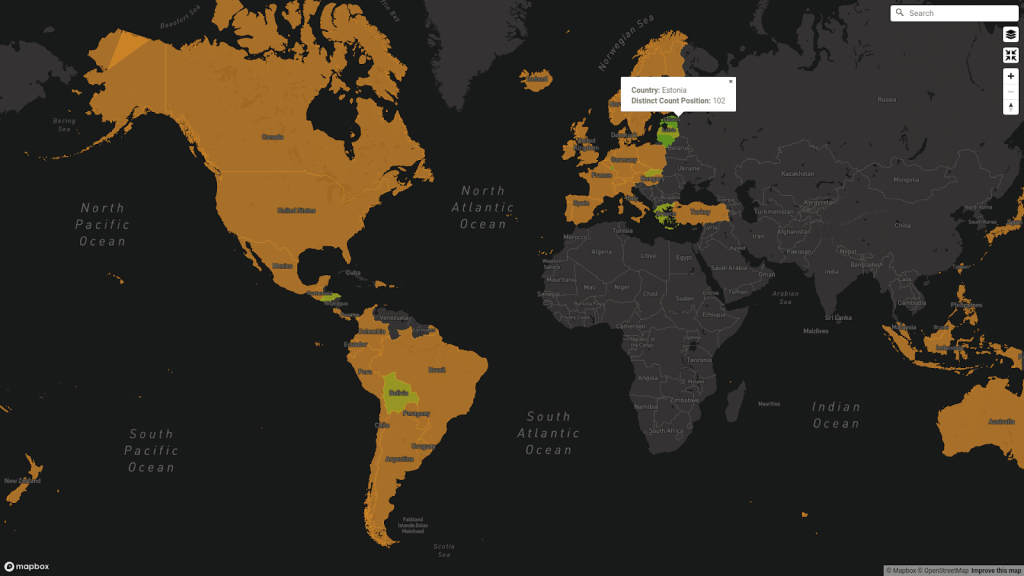
 Check if all regions/countries have data for each daily ranking. Looks like they do not! Some countries don’t have all the top 200 ranked songs.
Most countries contain the top 200 daily positions/ranks, but looking closely at the choropleth map, some countries don’t have information about the top 200 daily positions(see the countries in green shade).
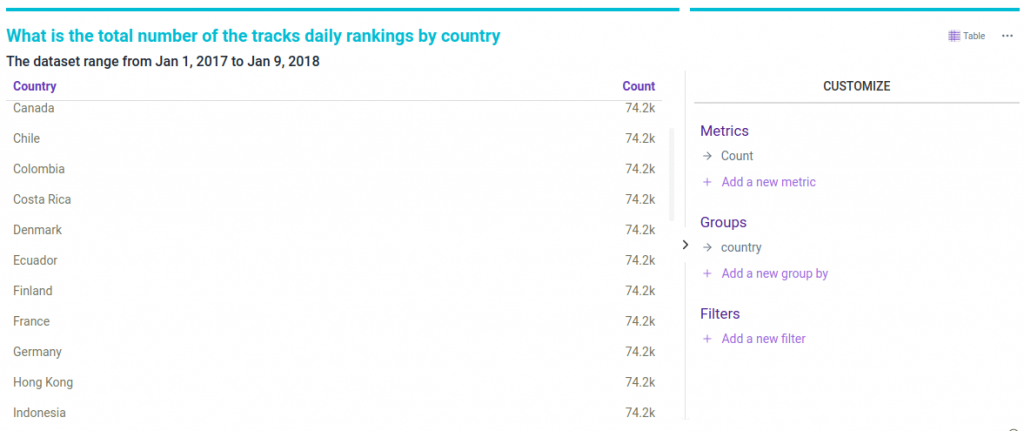
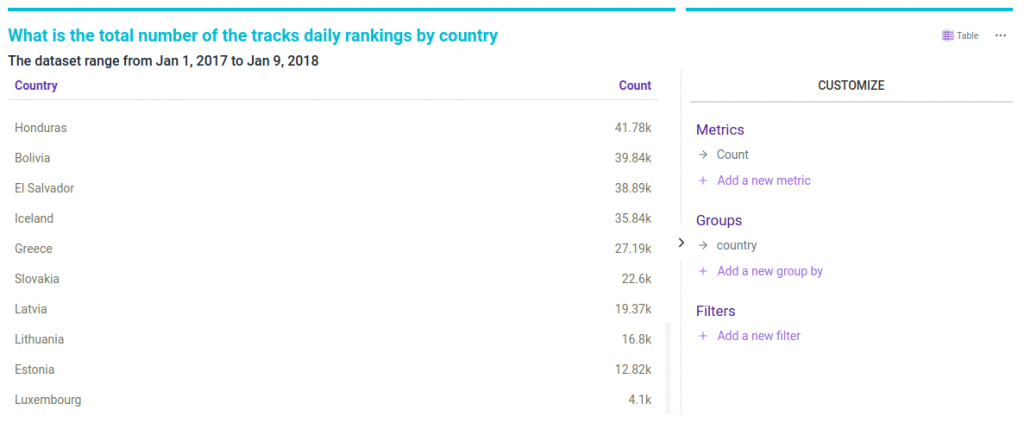
We can confirm this by checking the total number of rows of track ranking information per country/region. It is not consistent per region. Most countries got 74.2k records while some countries are below that. Thus, we need to be careful to draw conclusions when comparing regions.
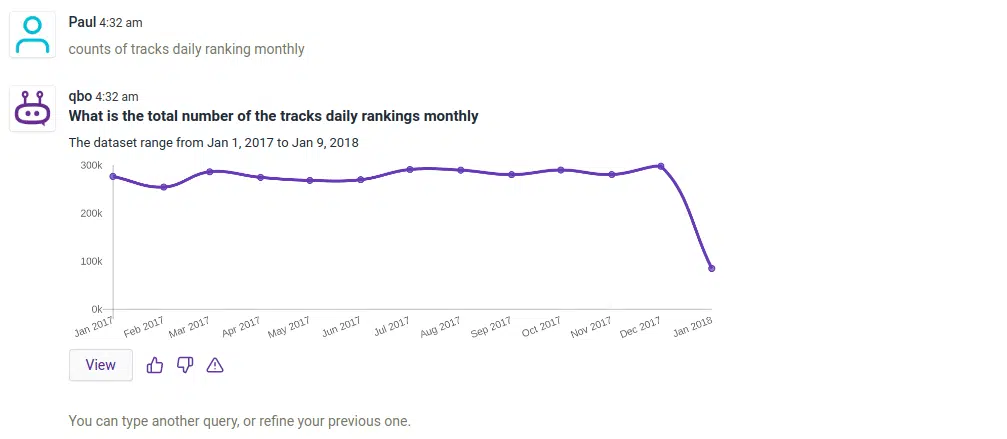
Here’s the number of track daily rankings information per month. The average number of data rows per month is around 300k for the entire year of 2017 and 100k in Jan2018 since there are only 9 days.
Data Exploration and Getting Interesting Insights
Now that we got a feel of the data, its contents, missing information and date coverage, let’s derive some insights using Qbo. Qbo, as a conversational analytics platform, provides a simple syntax for users in asking questions/constructing a query. Instead of the SQL query syntax which is too technical, one could ask a question in natural language, see available types of queries in documentation.
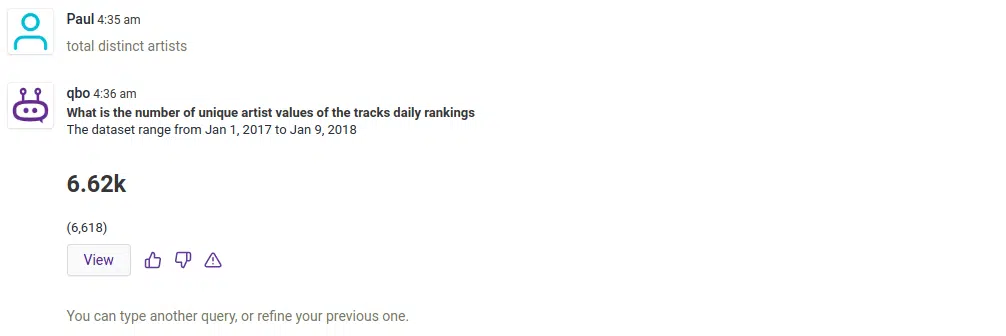
First things first, how many unique artists are there in the record?
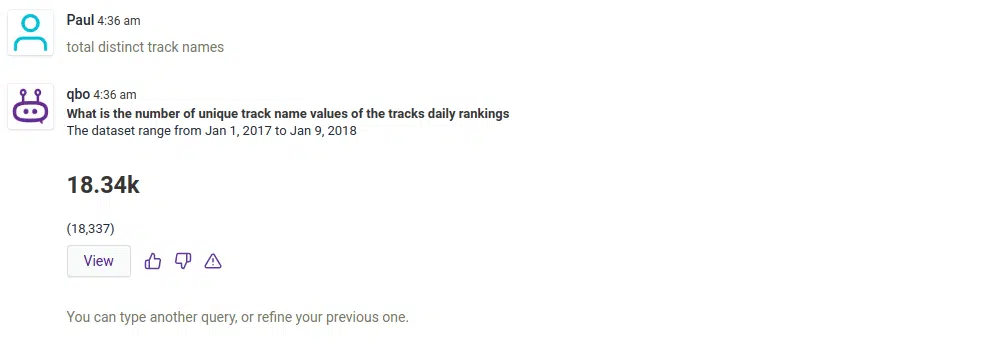
There are 18k unique songs/tracks that made to the daily rankings
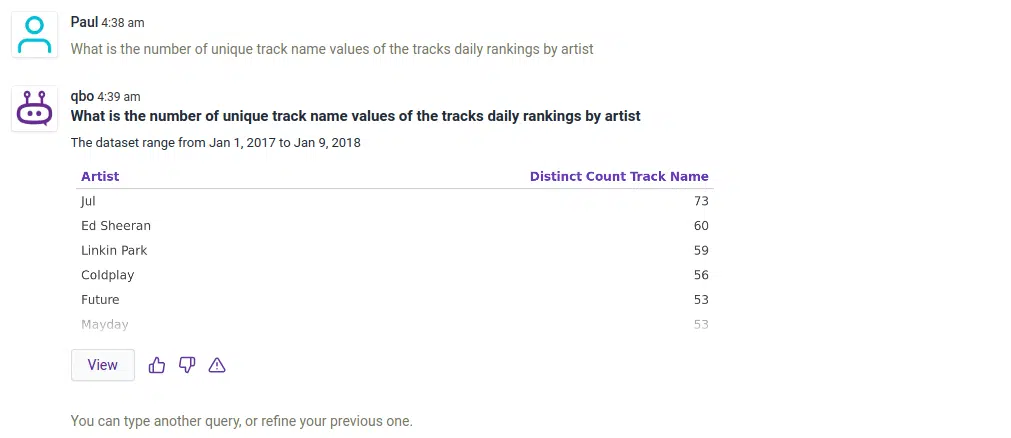
Now let’s get into some interesting insights using augmented analytics. Who are the top artists that had the most number of songs in the daily rankings? And we see that the top artist showing up is one that’s perhaps a bit unexpected. The artist named Jul has more songs in the top daily rankings compared to international artists like Ed Sheeran, Linkin Park, Coldplay, etc.
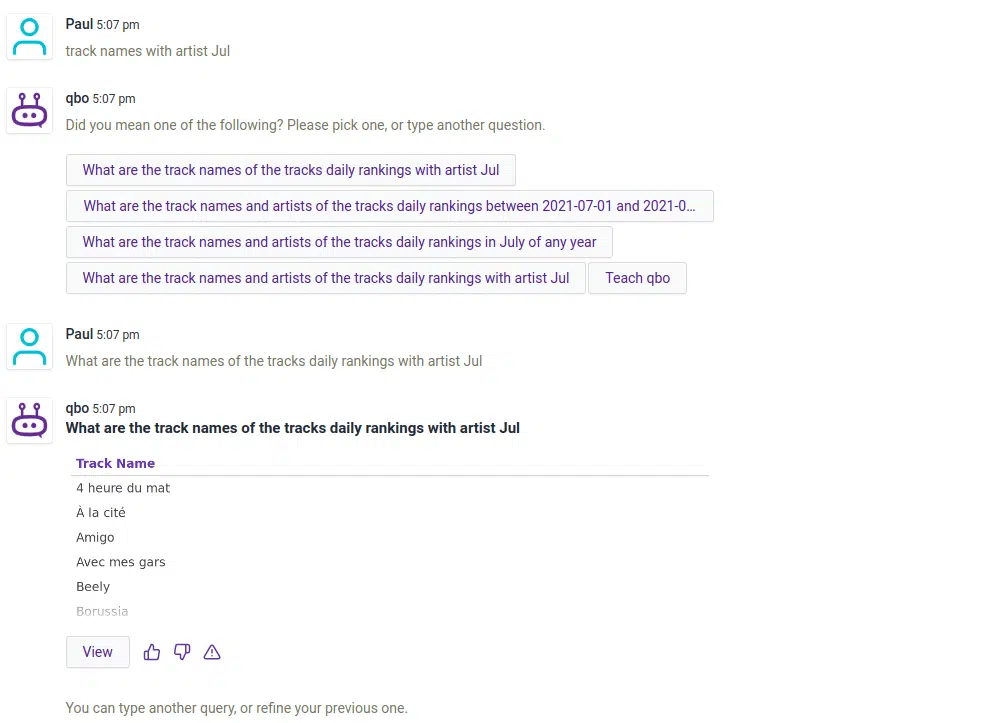
Interesting… at least I am not familiar with Jul. Let’s see some of his songs. Looks like he is a French artist!
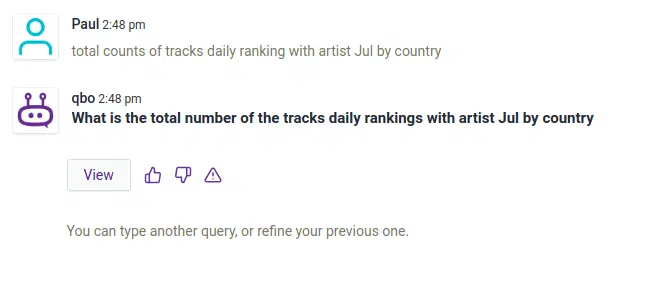
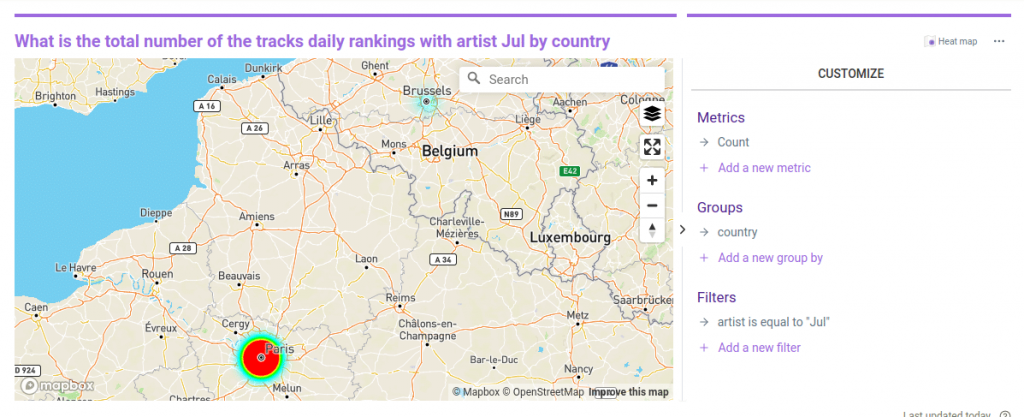
Now, let’s try to find out which country/region this artist Jul from. Right! He is from France.
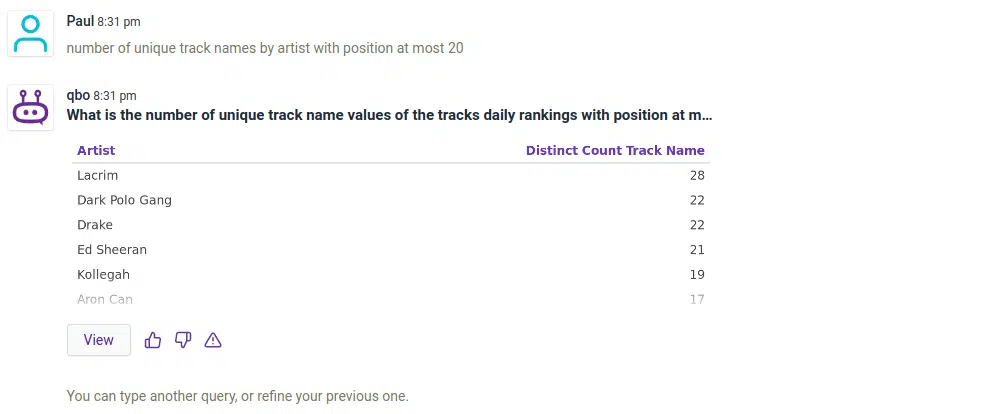
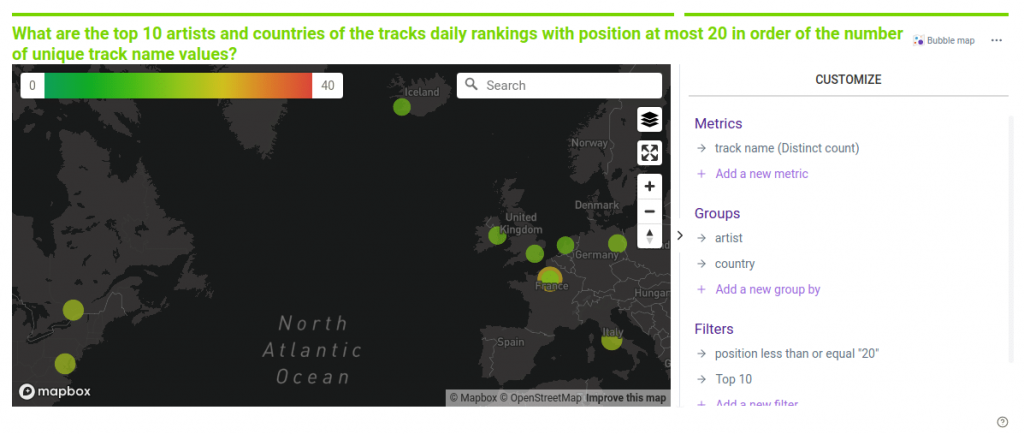
How about restricting the tracks that made it to the top 20 daily rankings? Which artists made the most of the songs/tracks? And we see new artists showing up.
Let’s find out which region/countries these artists from.

Who are the top artists with the most streamed songs? And Ed Sheeran got the top place.
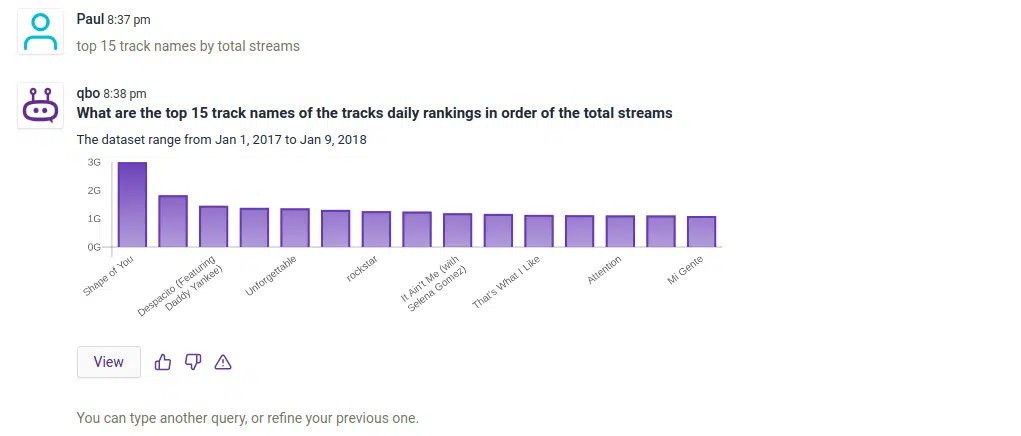

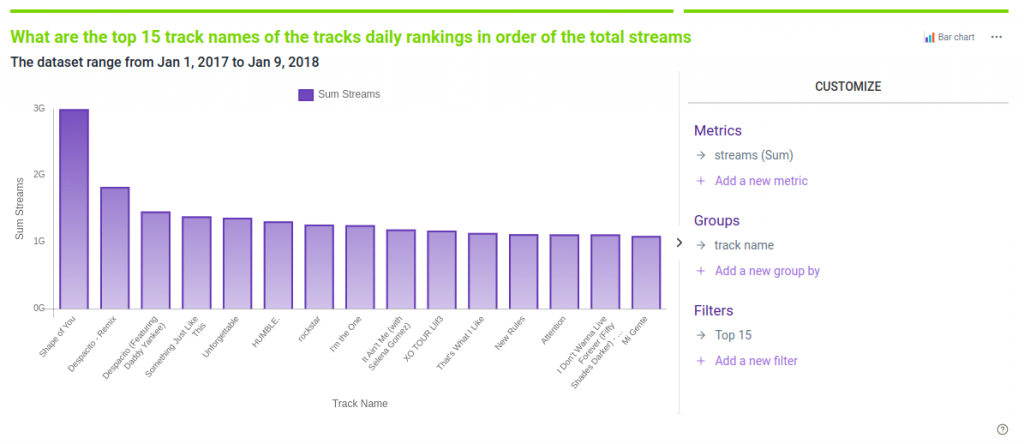
What are the most streamed songs?

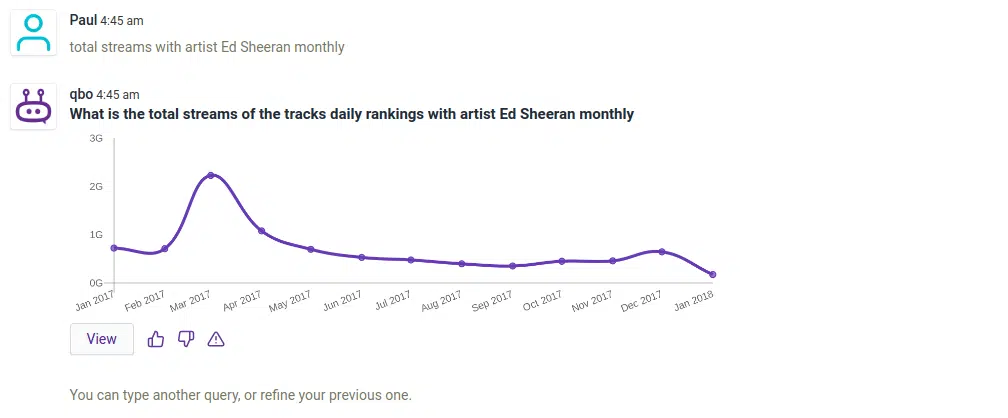
Now, let’s focus on Ed Sheeran. Here’s the total number of streams Ed Sheeran had per month. Looks like he made a hit song in March 2017!
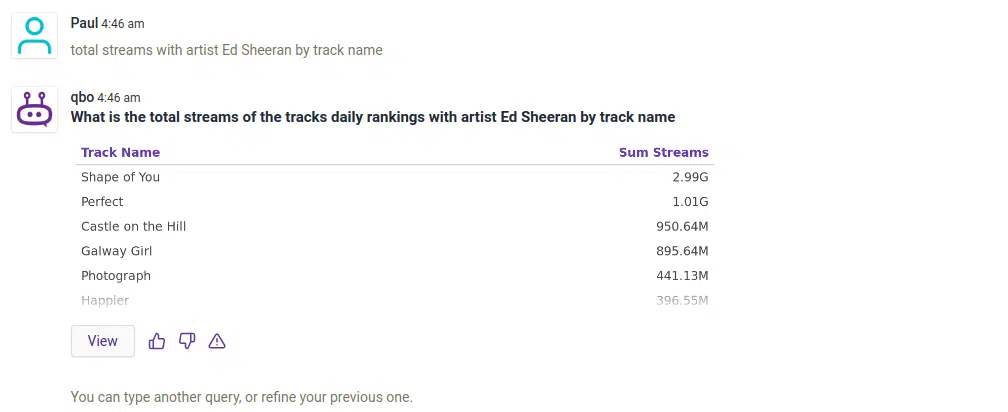
Here are the songs Ed Sheeran made and their corresponding total number of streams.
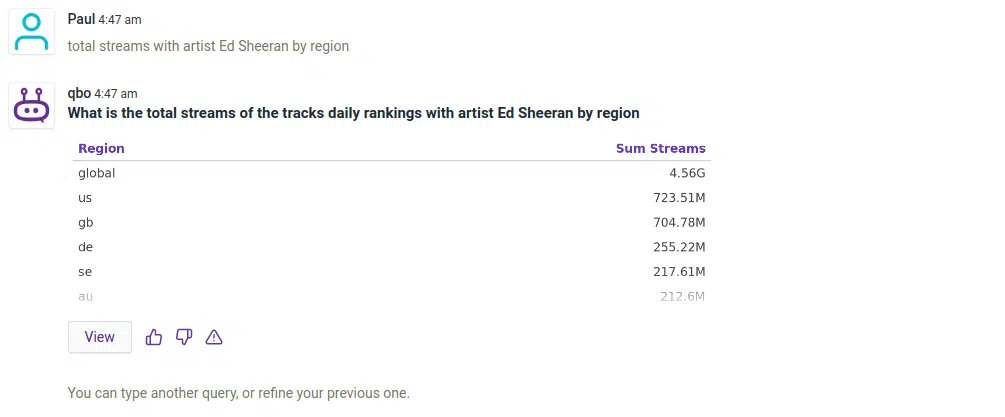
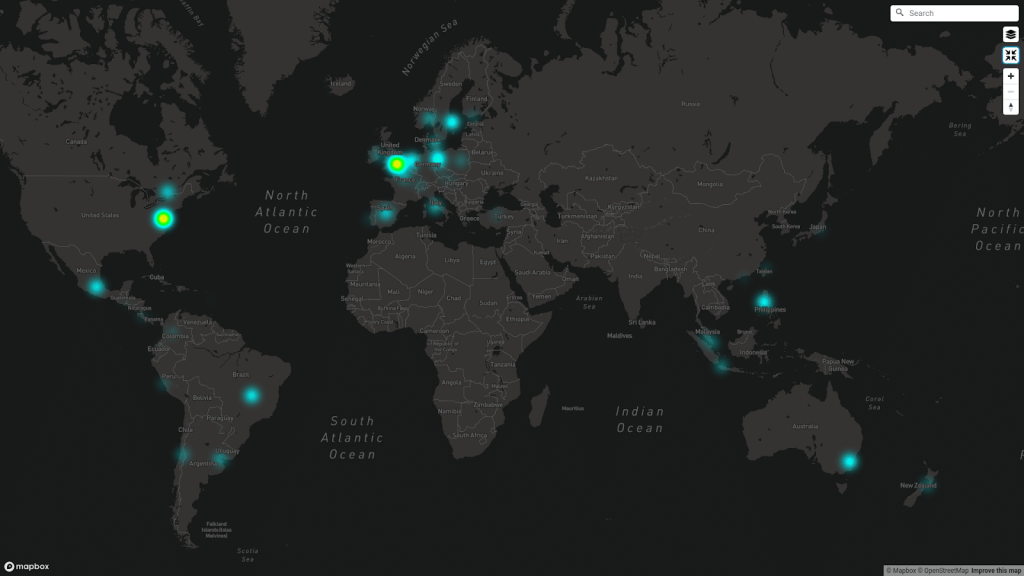
Which region/country Ed Sheeran is famous? Ed is famous in the US(us), Great Britain(gb) of course he is an English artist!, Germany(de), Australia(au), Philippines(ph) and Brazil(br), oh this is useful for a concert producer who wants to know where to start a world tour concert for Ed!
Which artists are listened to across different regions? Looks like these are global artists, nothing uncommon here.
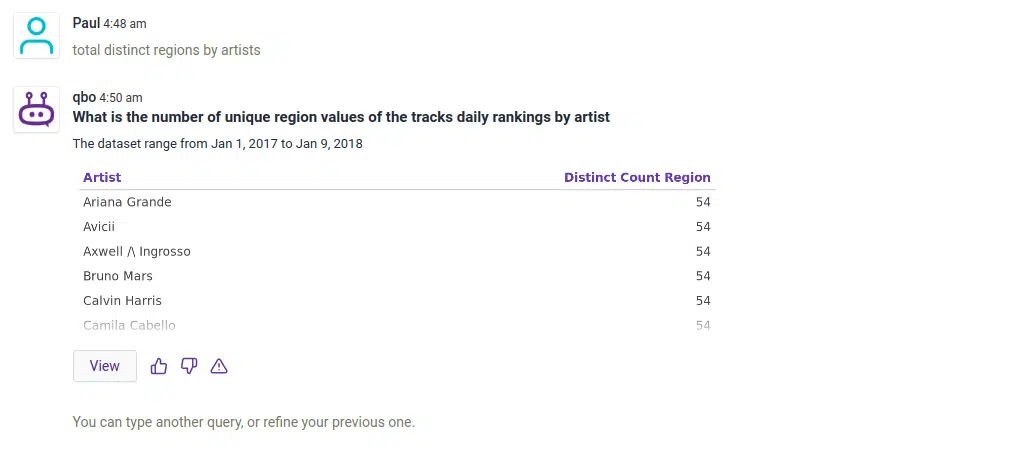
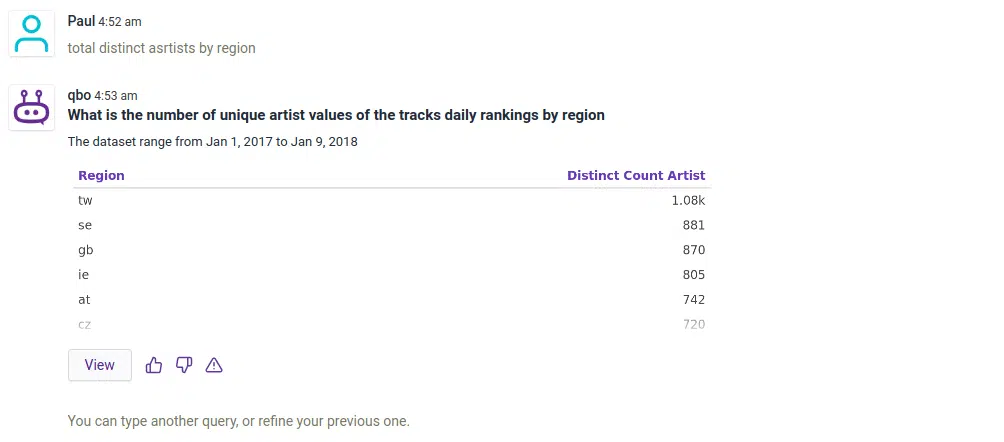
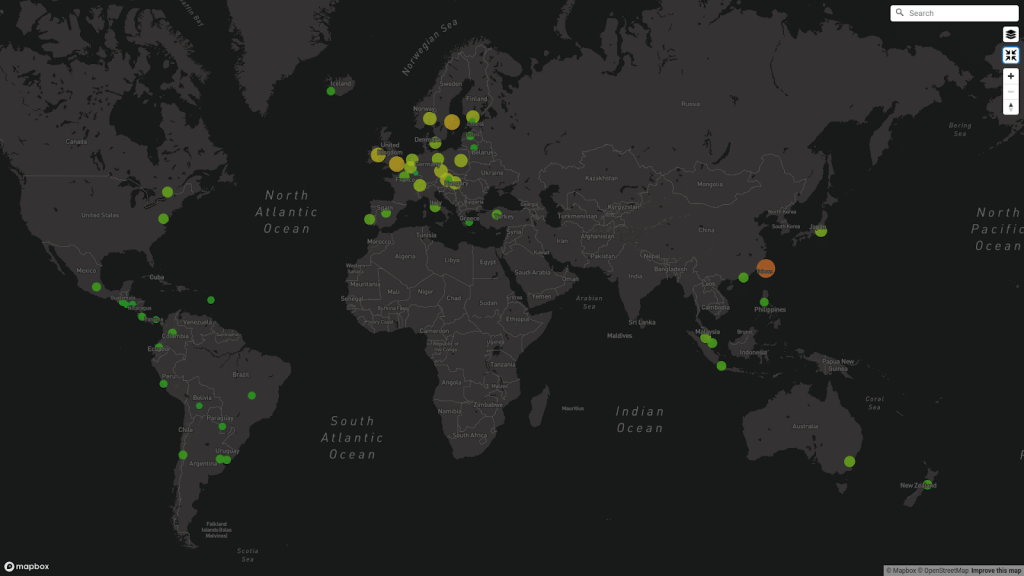
Which country/region listens to a variety of artists? Looks like Taiwan listens to a wide range of artists, interesting! We can discover this insight by querying for unique or distinct artists. Their top daily rankings change quite frequently too. Also, a side note, NLP still works even if a word is misspelled in the question.
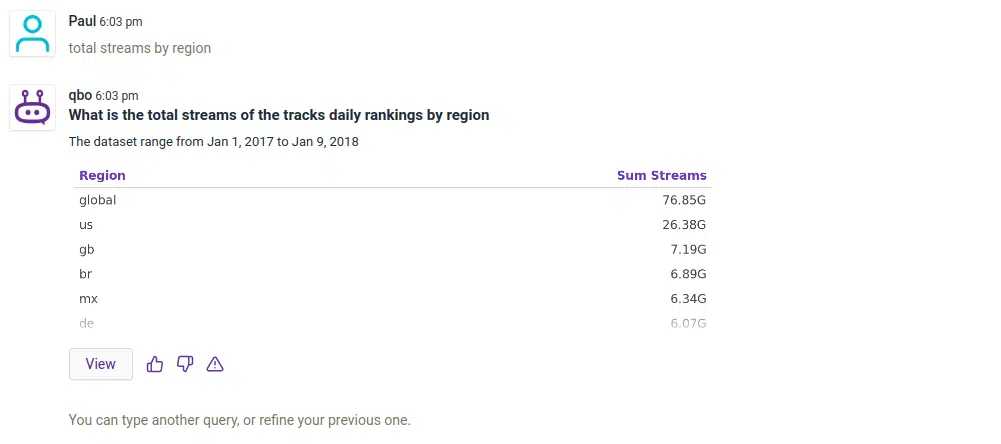
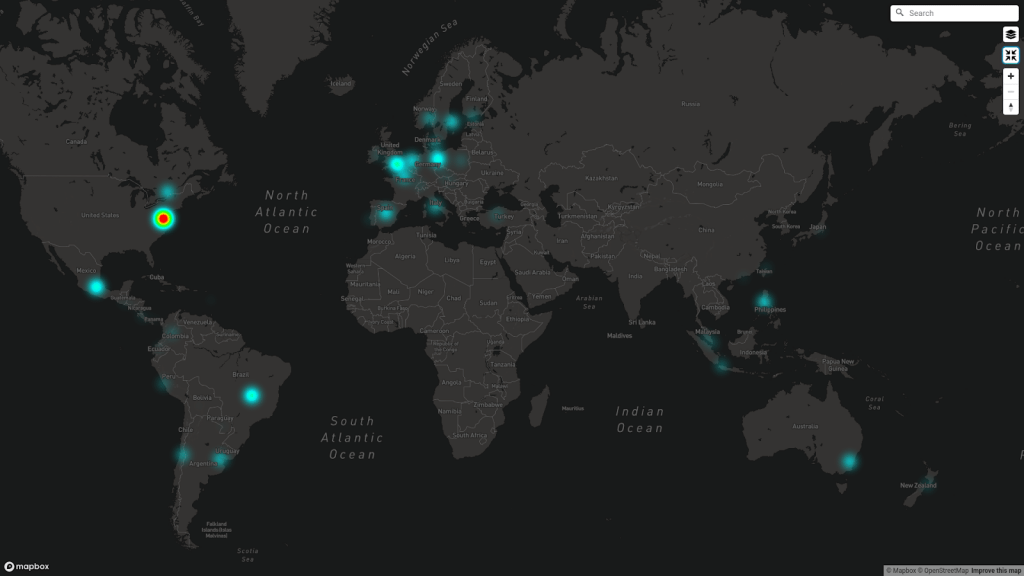
Which country/region had the highest number of streams? In the top place, we can see the US, Great Britain, Brazil, Mexico.
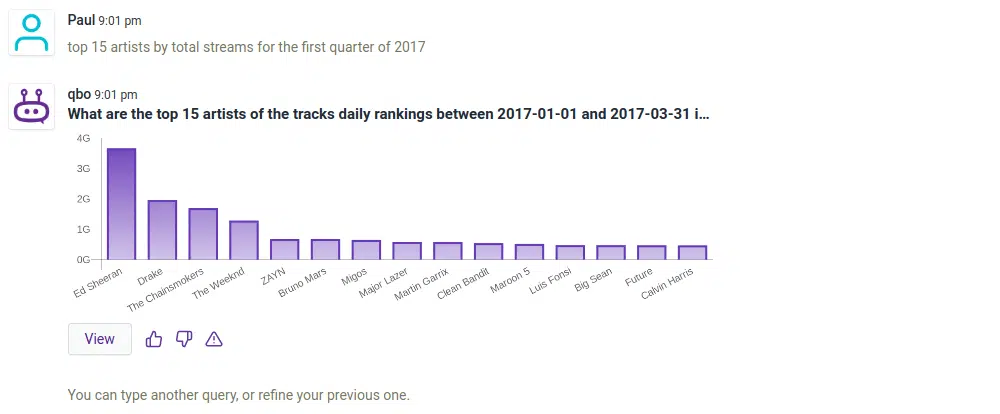
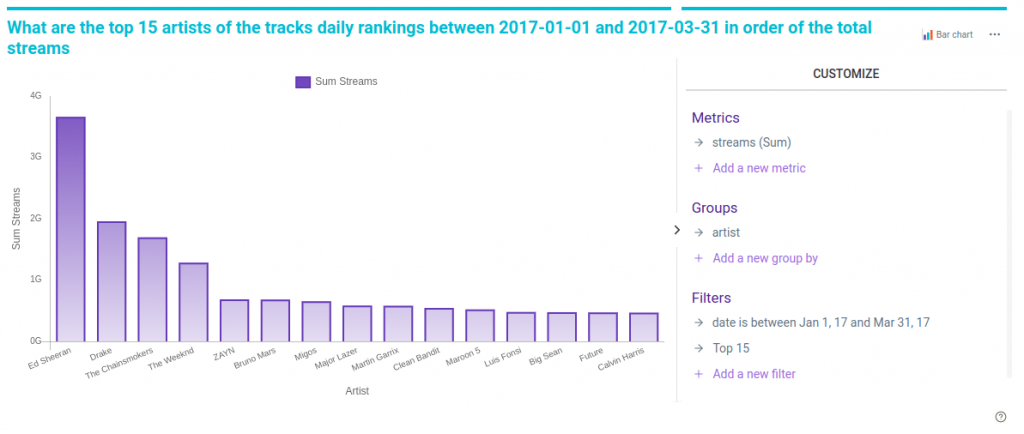
What are the top songs and top artists per quarter of 2017? We see that Ed Sheeran’s Shape of you dominated the first quarter!


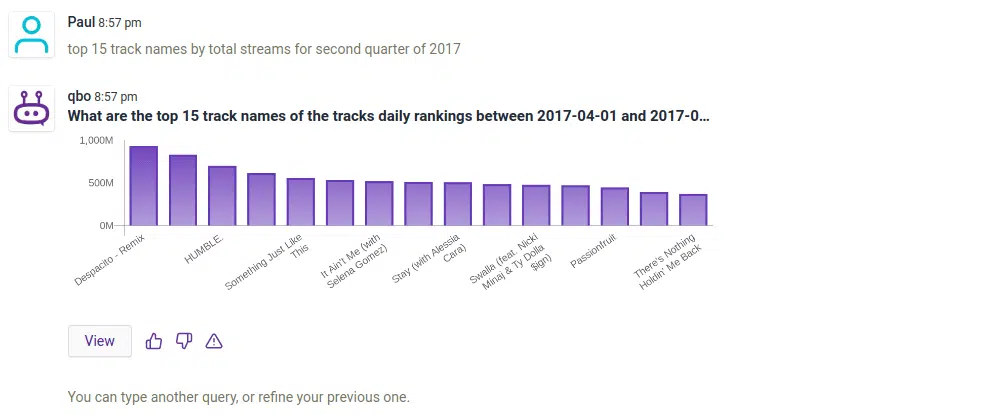
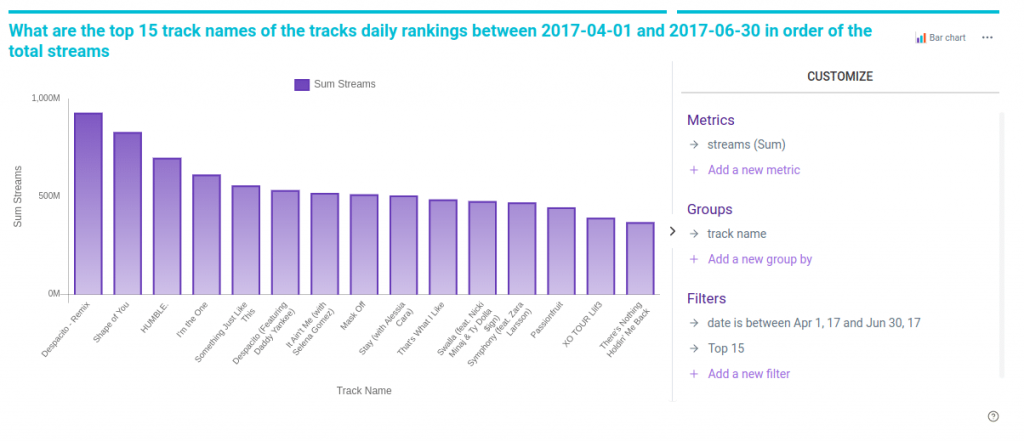
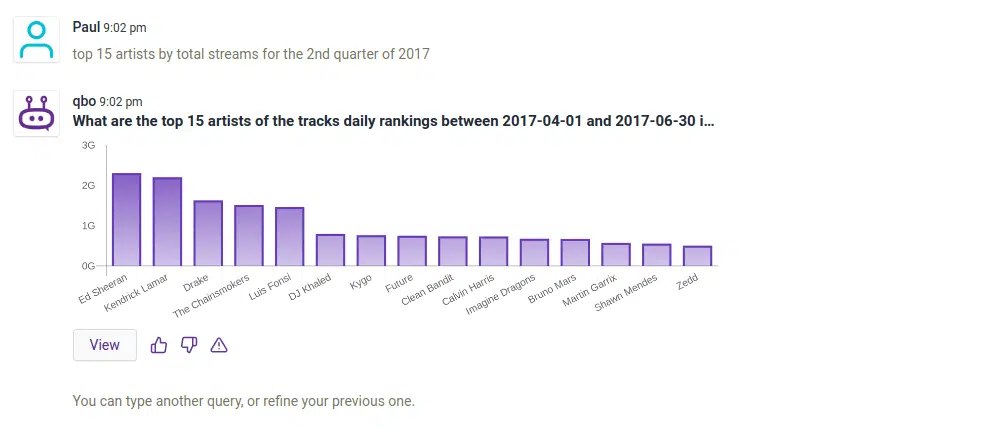
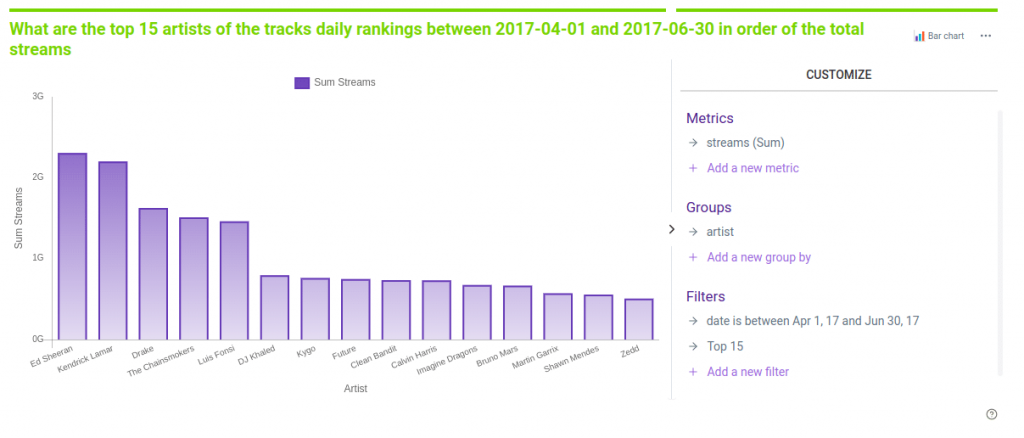
What are the top songs and top artists per quarter of 2017? In the 2nd quarter, Despacito replaced Shape of you but Ed Sheeran still remains the top most streamed artist for the 2nd quarter.
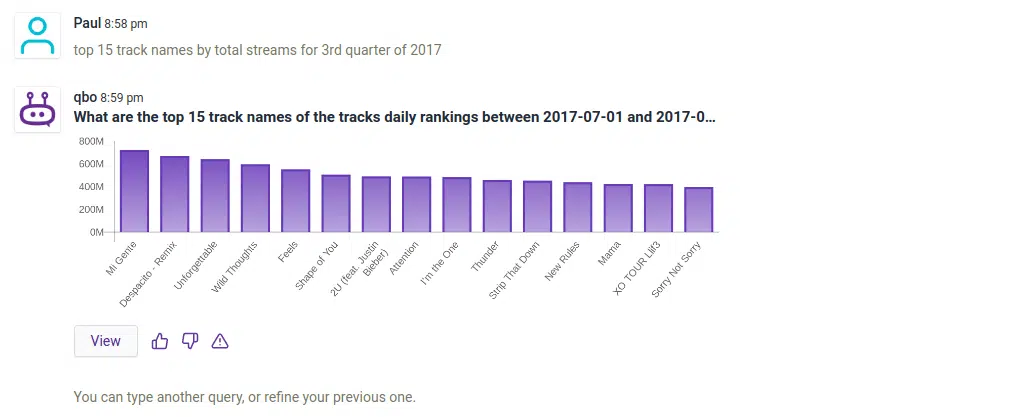
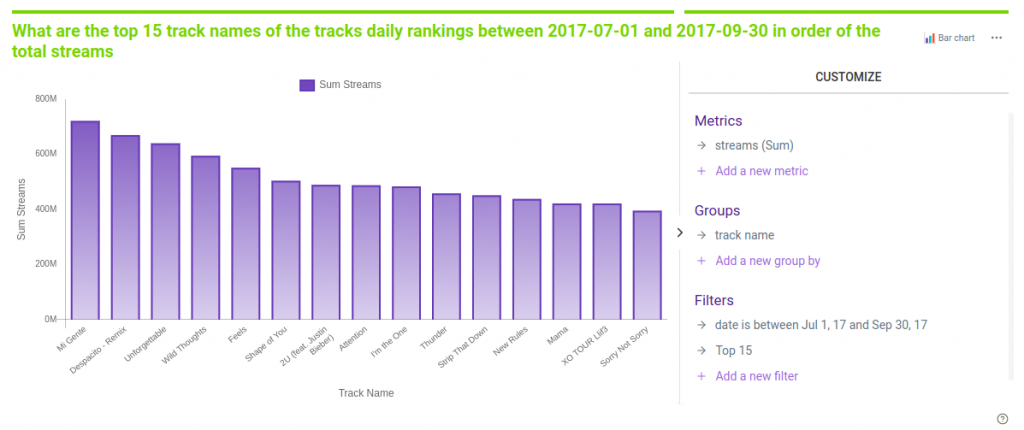
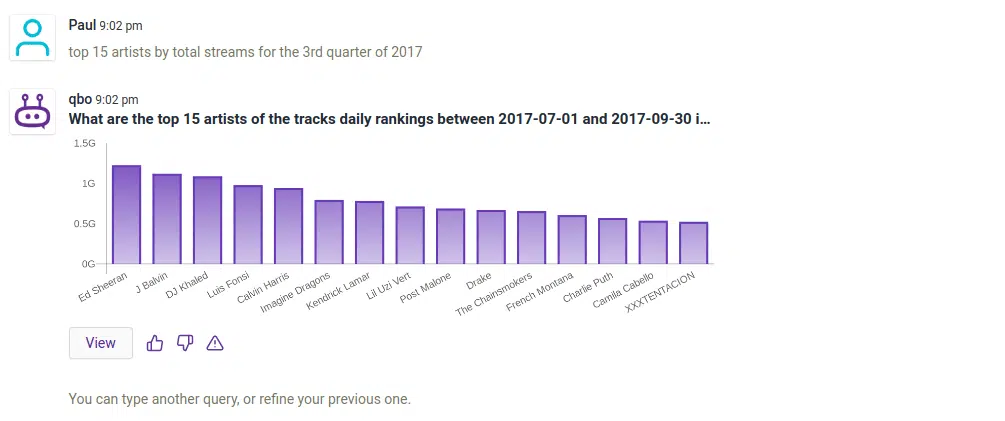
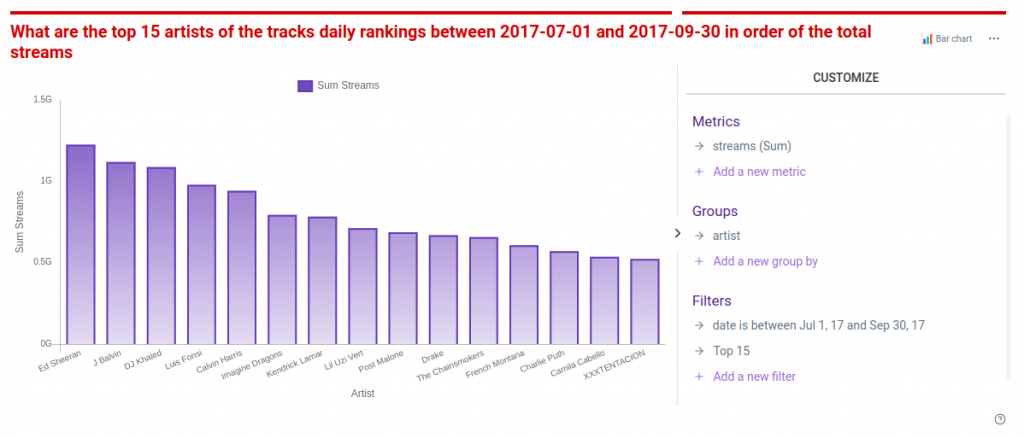
What are the top songs and top artists per quarter of 2017? In the 3rd quarter, Reggaeton/Latin pop songs(Despacito and Mi Gente) soared high in this quarter but Ed remains strong in the top most streamed artist!
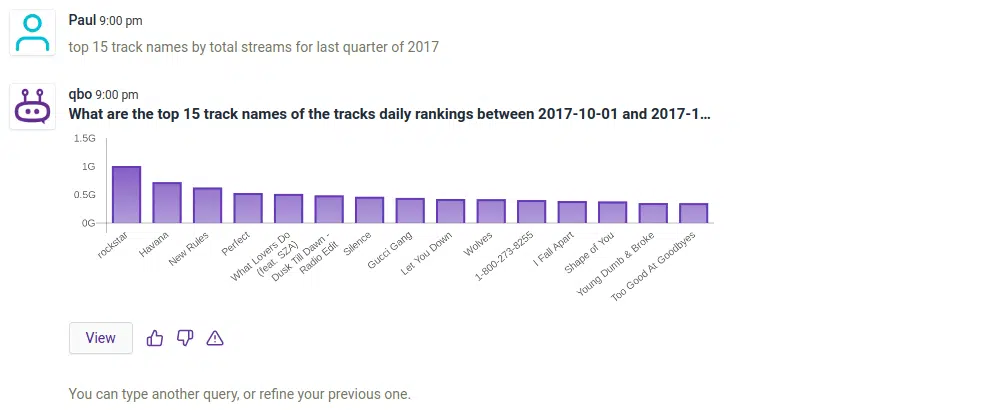
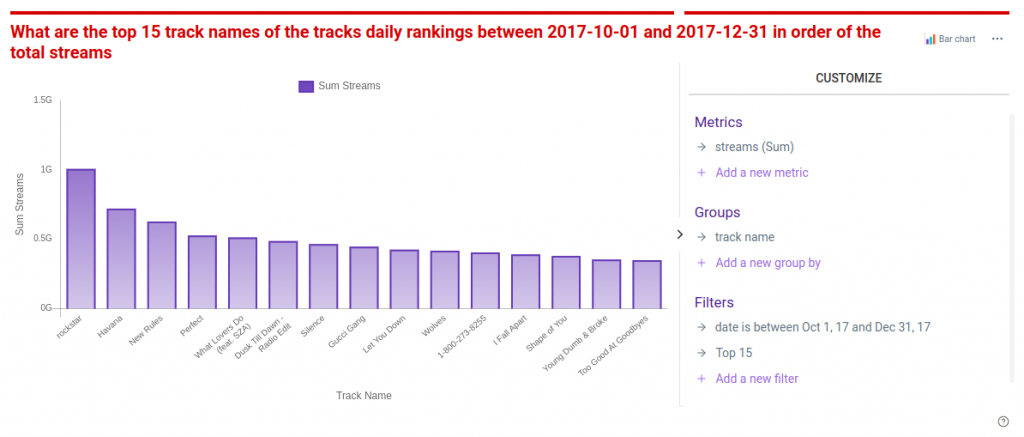
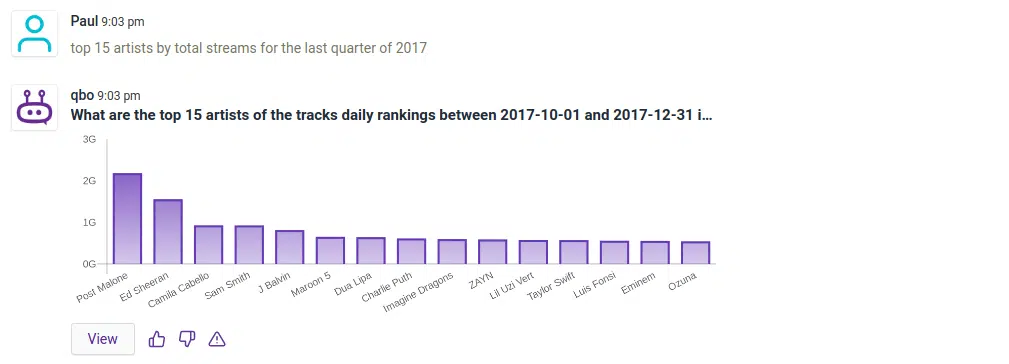
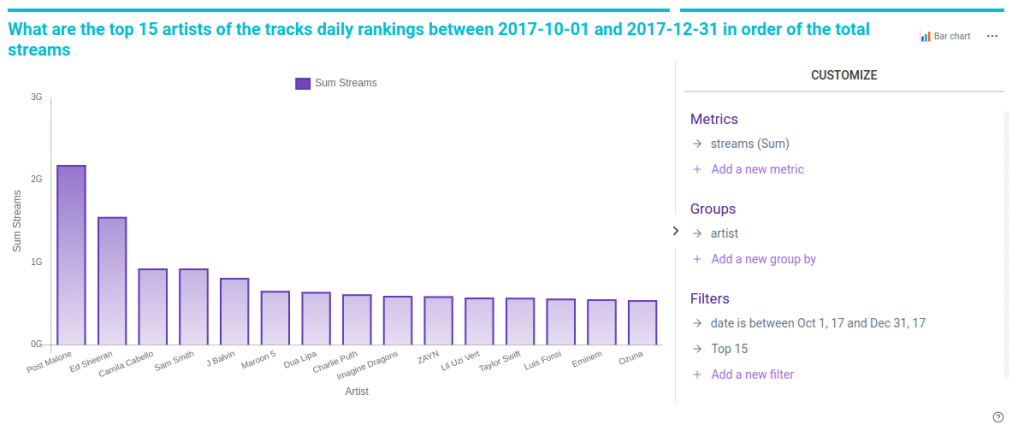
What are the top songs and top artists per quarter of 2017? In the last quarter, Post Malone came and took the top spot with his “rockstar” hit song!
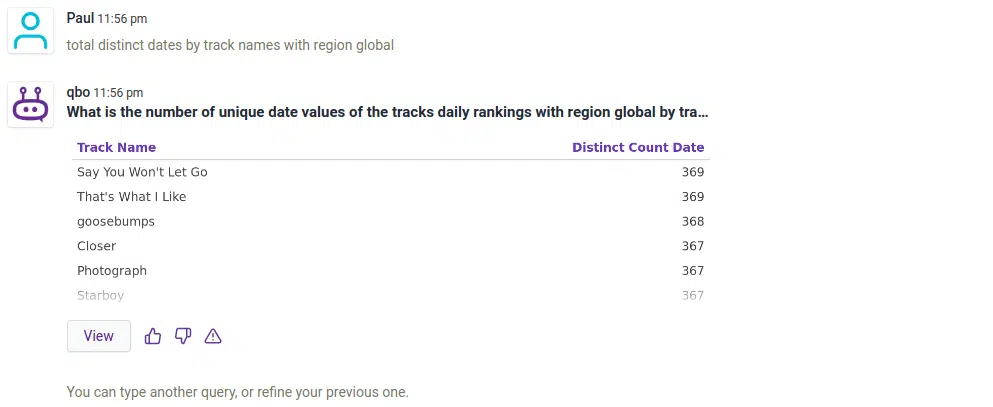
What are the songs/track names that made into the top 200 daily rankings the longest? Bruno Mars’ That’s What I like and James Arthur’s Say Won’t Let Go made it to the top place.
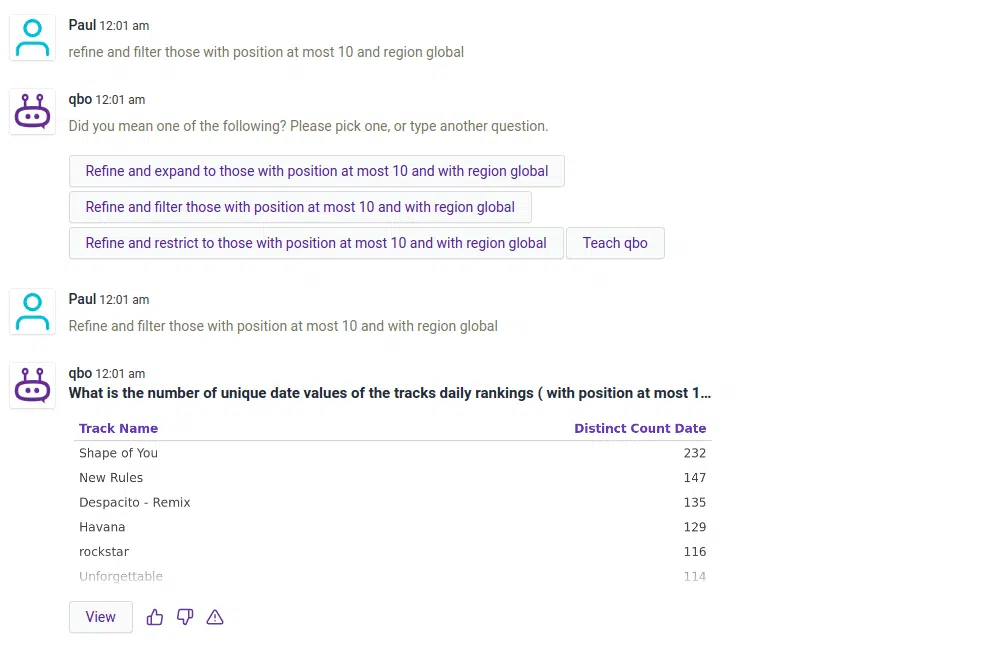
How about restricting the songs with rankings within the top 10? We see that Shape of You made it to the top 10 the longest among all songs.
And that summarizes our simple demonstration on how to use Qbo as a conversational analytics tool for data exploration and deriving insights. With this tool, all roles/teams in the organization ranging from nontechnical to technical users will be enabled and have a fair chance of getting involved in finding and uncovering useful and helpful insights from data for smart decision making initiative.
Unscrambl Qbo offer free 14 days trial for business professionals to get their hands on the tool and know how this tool empowers them to walk with their brand in the right direction and to delight their audience.
Sign Up and converse with your data today. The tool will show and comprehend the pattern as per your need and drive you to success.