9 Minutes

Natural Language Queries & Conversational Analytics for Digital Marketing
Conversational Analytics provides a way for users to ask questions in plain natural language on their data and engage in a conversation that can result in interesting and actionable insights. It’s a new paradigm in the space of Business Intelligence and Analytics that we believe will completely revolutionize the way business users interact with their data.
Conversational Analytics solves a key challenge that business users in enterprises face today, i.e. how can they get the right data and insights quickly enough to make informed decisions. They may not know where the data is located, how it is modeled, how to analyze it, and how to put together different datasets to get a holistic view of their business.
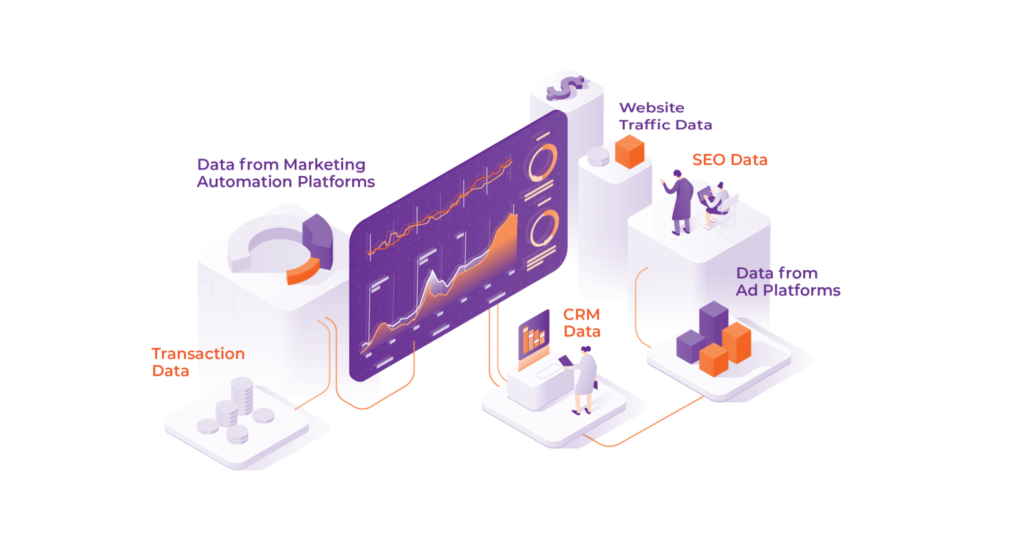
And this is especially a challenge for Marketing professionals, who today have to sort through a multitude of data sources to get an idea of how their marketing programs are going. They might use different applications for marketing automation, CRM, Ads, web traffic analysis, SEO, etc. And they might have several other internal datasets about customers, transactions, inventory, supply chain, etc. It is often difficult to analyze and make sense of data from even one source, let alone multiple disparate data sources.
In this article, we’ll show how conversational analytics can address some of the challenges being faced by users. We will first cover some of the key data and analytics use-cases for digital marketing. Then we’ll describe the challenges being faced by marketing users. Finally, we’ll describe how conversational analytics can help solve some of these challenges and give examples of how our conversational analytics system can lead to actionable insights.
Data & Analytics Use-Cases for Digital Marketing
There are several key goals behind using data for digital marketing :
1/ Increase website traffic, especially organic traffic.
Digital marketers need to know where their traffic is coming from, what times of the day or days of the week the traffic is coming, what are the key sources of the traffic (paid searches, referrals, social media, etc), what devices and browsers are people using to access their site, and how engaged users are once they get on their site. Such data can help marketers understand what is working to drive traffic and what is not.
For example, 90% of web pages get zero organic traffic from Google. However, companies that blog get 55% more web traffic. And 67% of clicks go to the first 5 results displayed in search engines.
Some of this data is collected and made available from tools like Google Analytics and Adobe Analytics. Other relevant data can be obtained from SEO tools like SEMRush and Ahrefs. However, it is often difficult for marketing professionals and other business users to get real actionable insights from these tools. And it is even more difficult to relate data from these tools to other key datasets like campaign and transaction data.
2/ Improve email marketing campaigns
While email marketing is still one of the most used marketing channels, it is often very difficult to get it right. For example, welcome emails have an average open rate of 82% , and 60% of consumers subscribe to a brand’s list to get promotional messages and deals. At the same time, 54% of all emails are classified as spam. And 91% of email users have unsubscribed from a company email they previously opted-in to.
It is rather difficult today to effectively track emails campaigns to know what is working and what is not. While marketing and email automation platforms might report high-level statistics on the number of emails sent and opened, it is often very difficult to dig deeper and figure out how to improve open rates and click rates. Again, it is very difficult to relate email marketing and campaign data to other relevant datasets like campaign and transaction data, and understand, for instance, how email open rates actually relate to revenue.
3/ Improve lead nurturing
45% of businesses send their leads one email per week. At the same time, 80% of new leads never translate into sales. Companies that excel at lead nurturing generate 50% more sales ready leads at a 33% lower cost.
Most companies find it a challenge to effectively monitor lead nurturing strategies to know what is working and what is not, and figure out how to improve conversion rates. While CRM and marketing automation tools capture raw lead data and present high-level statistics, it is not easy to dig deeper into them and get actionable insights. Furthermore, it is very difficult to relate this data to other relevant transaction or website traffic to get a holistic view of the enterprise.
4/ Optimize lead and opportunity conversion rate
Most organizations have a challenge in converting their leads. On average, for every $92 spent on acquiring a customer, just $1 is then spent on trying to convert them. Only about 22% of businesses are satisfied with their conversion rates. Personalized Call to Actions (CTAs) convert 42% more visitors than unpersonalized ones.
Again, while CRM and marketing automation tools have basic dashboards on lead conversion, it is not easy to dig deeper into them and get actionable insights. Furthermore, it is very difficult to relate this data to other relevant transaction or website traffic to get a holistic view of the enterprise.
5/ Optimize ad and campaign spend
Ads on Google, Facebook, Instagram and other channels form an important part of any marketing strategy. Businesses make an average of $2 in revenue for every $1 they spend on Google Ads. However, the average click-through rate (CTR) in Google Ads across all industries is 3.17% for the search network and 0.46% on the display network. And ad costs can quickly add up, with an average cost per click (CPC) in Google Ads across all industries is $2.69 on the search network and $0.63 on the display network.
Hence, optimizing ad spend and in general campaign spend across all channels is critical. This needs data, and especially insights on how ad spend on different channels and campaigns actually correspond to increased number of leads, closures and finally revenue. Again, this needs pulling and correlating data from different sources to get a holistic view of monitoring and optimizing ad spend.
6/ Compare against competitors
Finally, marketing professionals would like to compare and benchmark against their competitors, especially in how they are doing with driving traffic and nurturing leads. Competitor data is spread across different tools like SEO tools and market research tools. However, given that such data is spread out, it is often difficult to gain useful insights and especially correlate them against internal datasets.
Key Challenges
As we saw above, there are several important use-cases for data usage in digital marketing; however, there are challenges in getting insights from the available data. To summarize, the key challenges are :
1/ Multiple data sources
Relevant data for each use-case is spread across multiple sources. It almost needs a dedicated IT or analytics team to manage these data sources and even then, it’s quite inefficient for users to get relevant data quickly.
2/ Limited data exploration and analytics available in applications
It is often difficult to get actionable insights from one source, let alone multiple sources. While most applications (marketing automation, CRM, SEO, web traffic, Ad platform, etc) offer a limited number of predefined static dashboards, it is often difficult to drill down and get more detailed and actionable insights. They are not suitable for quick informed decision making.
3/ Combining and Correlating disparate data
In order to obtain a holistic picture of marketing activities, a marketer needs to look at different datasets together, ideally in the same interface, and then find interesting relationships between them. The most interesting insights would come when data from various applications and internal transaction or customer data are brought together. However, this is quite challenging to achieve.
4/ Collaborating on insights
Finally, a key challenge faced by organizations is collaborating on data and findings. A lot of analysis takes place in Excel sheets which are difficult to collaborate in. It is very difficult for different people in an enterprise to jointly look at various datasets and jointly come up to a common conclusion on insights and next steps. Another big challenge is that common collaboration platforms like Slack and Microsoft Teams have no way for users to access and explore data. So, data is unfortunately divorced from collaboration.
How can Conversational Analytics help?
The dream of conversational analytics is that users can ask questions against their data in plain natural language, and dig into the data in any way they want to. Furthermore, it can help in uncovering and sharing actionable insights from possibly multiple data sources.
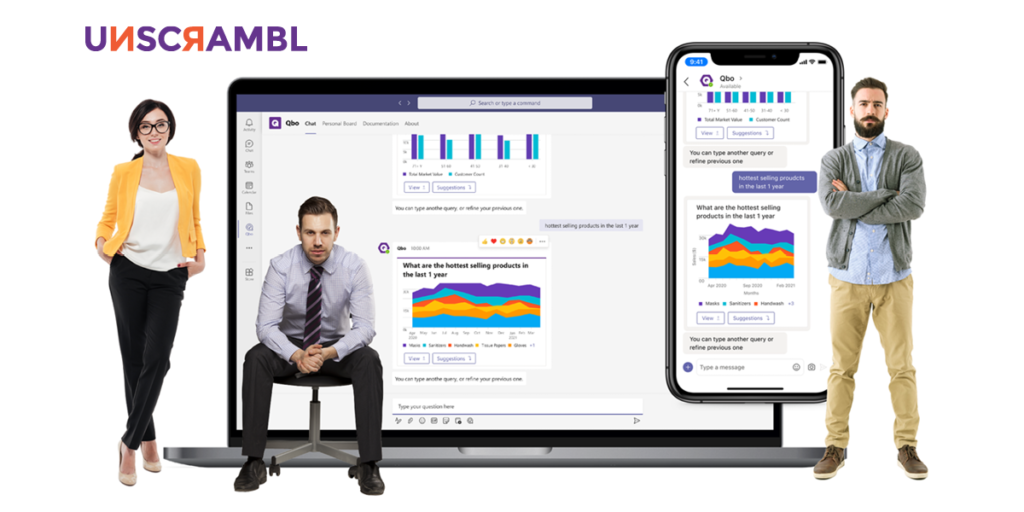
In a conversational analytics system, users can chaDuplicate Postt with a bot, asking analytical questions on their data. The bot can respond using charts, maps, text and other widgets — anything that can help explain and present the results in the best possible manner.
Let’s now dig a bit deeper into the key advantages of a conversational analytics system, like Qbo.
Connect to Multiple Datasets
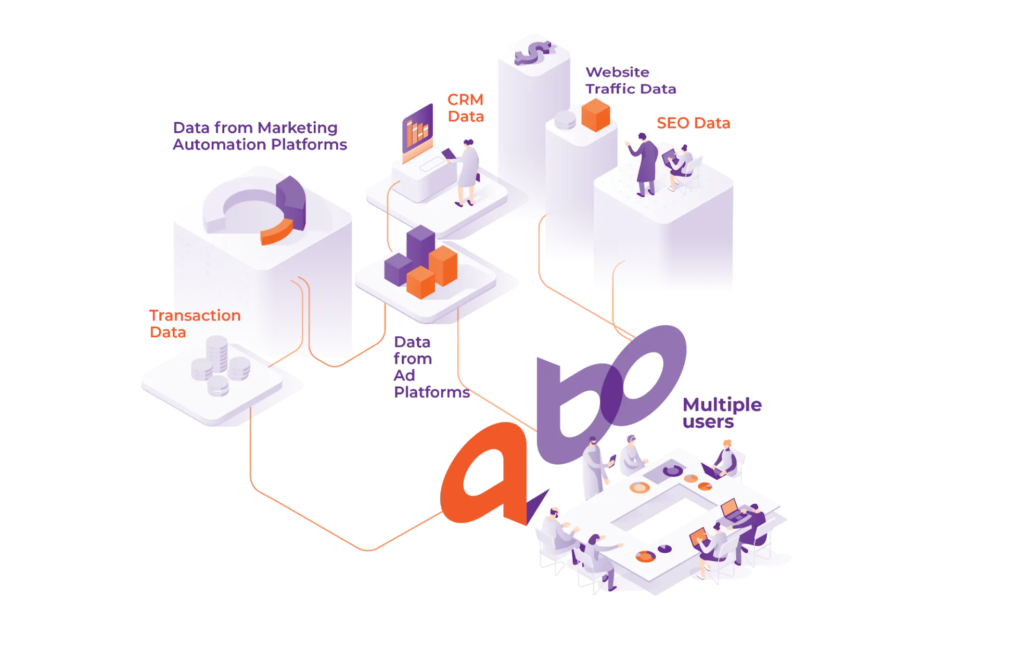
The key advantage of a conversational analytics system is that it can sit between users and multiple data sources. It is the job of the bot to figure out which data source(s) best answers the users’ questions. This makes it convenient for users to have a single front-end for all their data and analytics needs. Furthermore, they can ask questions the way they want … rather than be dictated by the terminology used in any given dataset.
For example, we might be able to ask a sequence of questions in a single thread of conversation as follows :
- How many leads were created monthly in the last 12 months (on CRM/Marketing Automation data)
- What was the corresponding number of website traffic sessions in the last 12 months monthly(on Website Traffic Data)
- How did organic traffic coming to my website compare with competition in the last 12 months monthly (on SEO Data)
- What was the corresponding spending and Click Through Rate on Google Ads in the last 12 months monthly (on Ad Data)
Slice and Dice the data any way you want, conversationally
An important advantage of a conversational analytics system, as opposed to a dashboard, is users can ask anything from a potentially infinite space of questions. They can drill into any dimension of the data, group and filter the data in innumerable ways, see trends on any metric at any level of granularity, compare any two pieces of data across different periods of time, ask for analytical results on any set of attributes and any target variable, etc. They are not limited by the constraints of a few widgets in a dashboard. They are free to take their own journey through the data.
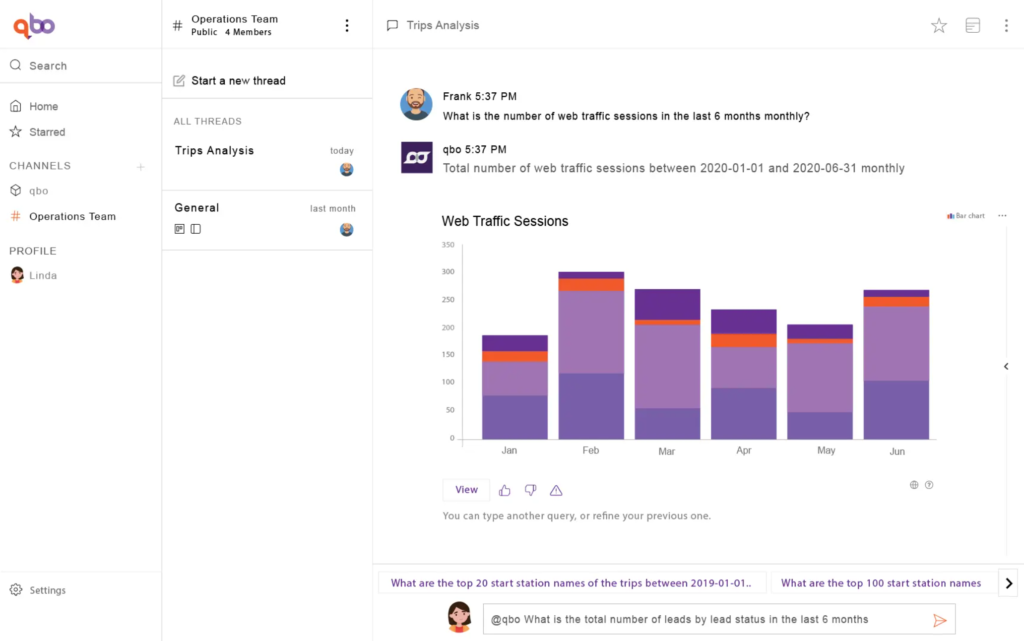
Furthermore, a conversational analytics system allows people to ask an initial high level question, and then ask subsequent questions to refine the analysis. See the figure below to see an example of a refinement flow.
For example, we might be able to ask a sequence of questions in a single thread of conversation as follows :
- What is the total number of leads by lead status in the last 4 months
- Refine and further group monthly
- Refine and show for male leads only
- Refine and show for leads in New York
- Refine by lead source
Understand relationships between different datasets
One of the benefits of having connectivity to multiple data sources is that users can now understand interesting relationships between different datasets. In the past, it would have been very difficult to uncover these relationships, and they would have been hidden to users. But, now users can ask questions to a conversational analytics bot about different datasets one after another in a single thread. Further, the bot can uncover relationships between metrics across different datasets as part of it’s augmented analytics capabilities.
For example, the bot can help understand relationships such as:
- How is the number of leads related to average session duration on the website
- How does email open rate impact net revenues?
- How does organic search engine traffic relate to opportunity progression?
Group chat to collaborate and share findings
A key by-product of conversation is collaboration. It’s no wonder that most common collaboration platforms like Microsoft Teams, Google Chat and Slack all have chat functionality as their core. A conversational analytics bot can be part of these platforms and can support group chat — where different people can chat with each other as well as the bot to uncover insights from the data together. This can help improve data literacy across different members of a team, and can also help joint decision making.
For example, a group of people may chat with each other and with Qbo as follows :
- VP Mktg Jane : I think we are not getting as many leads this year
- Marketing Analyst Eyre :@qbo what is the number of leads created monthly this year and last year?
- VP Mktg Jane : @qbo Why is the number of leads created in Jan 2021 less than Jan 2020
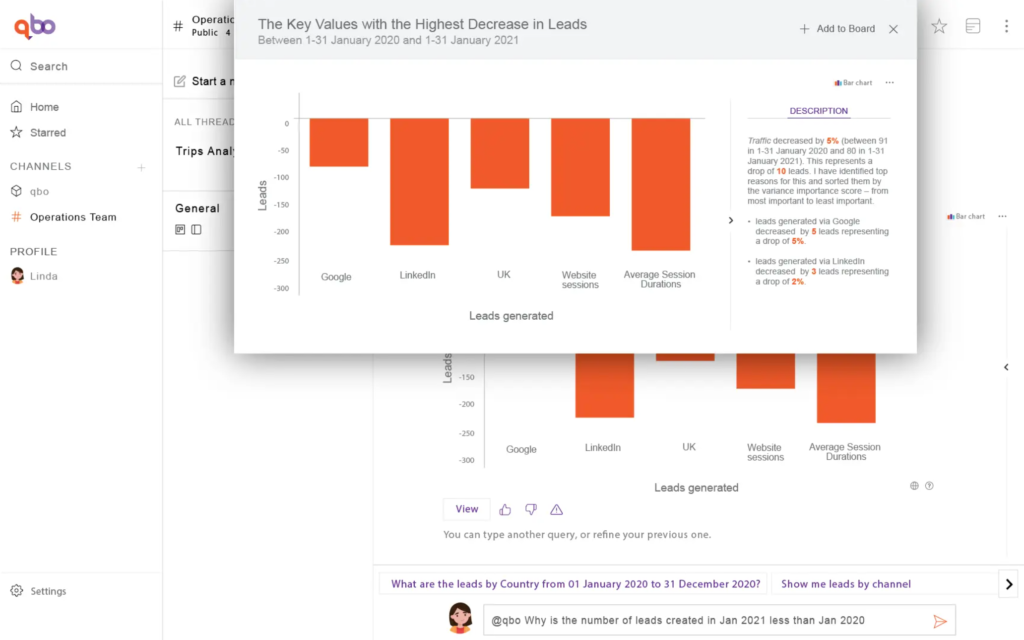
- COO Fonda: Seems like we are not getting as much organic traffic
- COO Fonda :@qbo show number of website sessions year-over-year
As marketing drives towards a full omnichannel experience, marketers will need to effectively optimize their campaigns to deliver the best ROI for their clients.
At Unscrambl, we have created a business intelligence solution that is powered by augmented analytics.
With Qbo, marketing agencies will be able to seamlessly integrate and analyze all of their marketing data without the need for technical expertise to make data-driven decisions.
Data from Marketing Automation platforms, CRM Systems, Ad Platforms, SEO Platforms, Website Traffic, Transactional Data, etc., can be lying in different applications in the cloud, on-premise, or internal databases. This creates both opportunity and challenge. Opportunity to uncover the greatest potential and challenge to make sure that all the data is considered before making a decision. Accomplish your goals without the hassle of complex tools dashboard, and do empower your employees to achieve more.
Embark on a free 14-day trial and see how your agency can easily utilize the power of augmented analytics to deliver better results for your campaigns and clients.