3 Minutes
How Dashboards Are Weighing Down Your Data Team
Dashboards are a staple in data-driven businesses everywhere, favored for their ease of use and convenience. They help monitor business operations, track available data, and plot company strategies. However, this tool could be outdated because it can be held back by many boundaries, which can prove counterintuitive to data management. Here are a few reasons why this is the case:
1. Need for Constant Monitoring
Dashboards are excellent tools for overseeing business processes, but they aren’t very useful for collecting data from new sources. This is because the software only tracks the key metrics that it’s programmed to display. Unless configured otherwise, dashboards won’t highlight new types of data.
For example, if a company’s digital marketing dashboard is dedicated to displaying key statistics about leads, then they may not be able to pinpoint what’s driving conversions. They could opt to set up a new section on their dashboard that shows metrics on the effectiveness of their digital marketing and lead generation campaigns. However, this would need even more careful monitoring for the company to draw correlations between data sets. Without the help of intelligent AI programs, data discovery through dashboards is tedious at best. The manual work can then lead to fatigue for data teams. This can cause employees to miss out on what could be crucial information, barring them from producing data-driven insights. It might even lead to faulty data processing, which produces inaccurate results. Such pitfalls include cherry picking and data dredging.
2. Data Snapshots
Dashboards provide an easily digestible snapshot of data. This gives employees a general overview of current company statistics, which can be very useful. However, it’s important to note that the snapshot is only a small portion of the entire database.
One example of this is when percentages and statistics in a dashboard are averaged values drawn from specific data sets. This is why you need qualified data experts who will be able to dig deeper into these figures for more accurate insights. Those who hold a bachelor’s or master’s degree in data analytics will be skilled in forecasting and predictive modeling, and able to derive valuable insights from raw data sources. Unfortunately, the same cannot be said for the rest of the workforce, which is why it has become vital that companies invest in hiring a data specialist.
And while it is primarily the job of data teams to manage such processes, data should also be accessible to other employees. This promotes data democratization within the company, which allows for data-driven decision-making in all facets of the business.
3. Lack of Context
Dashboards gather data from multiple sources and collate them into a neat visual presentation. As was stated above, this provides a general overview of the business. But what’s lacking from the dashboard’s clean data visualizations is context. Context is vital when it comes to data management because it helps in making more fine-tuned insights and, therefore, more informed business decisions.
For instance, the total number of sales in a month is an important metric on its own. But to truly understand the factors that contributed to the final value, context is required. Otherwise, the different departments of a company are free to interpret that metric however they want. The marketing department might take that as a sign that their current campaigns are effective. Meanwhile, the product management department might see it as an opportunity to design similar products — even though neither is necessarily the case. Without contextualized data, the workforce won’t be on the same page, and that can prove detrimental to business productivity.
Dashboards are excellent for monitoring uncomplicated business operations and keeping track of straightforward statistics. However, they fall short in terms of data analytics and management. Luckily, there’s a more efficient option — conversational analytics. This intuitive dialog system answers the user’s questions about data in conversational English. Consequently, employees from every department of the company have easy access to the data they need.
Empower Your Data Team With Intuitive Dashboards That Connect With Your Audience
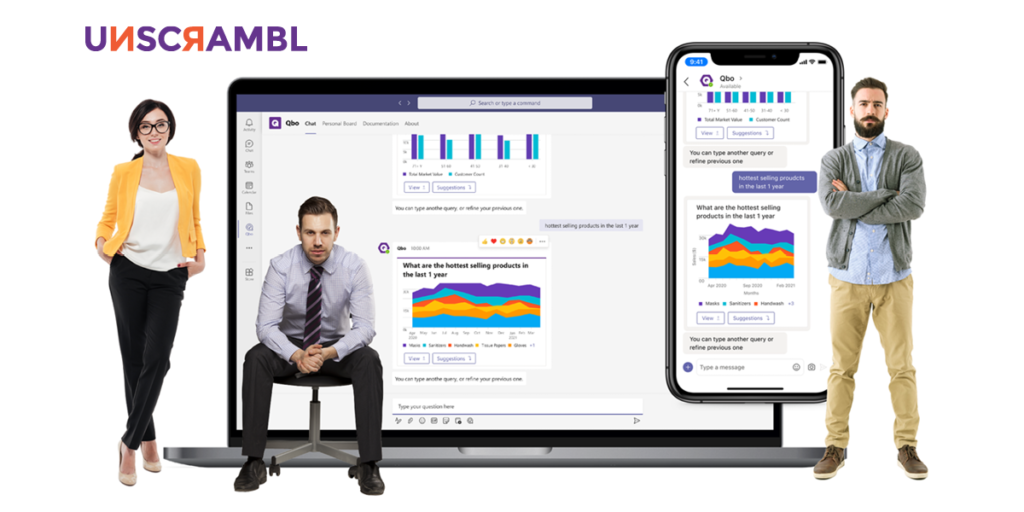
As companies move towards being data-driven, having intuitive dashboards that can truly connect with users is becoming absolutely essential. At Unscrambl, we have developed a business intelligence tool, Qbo, that promotes data democratization across your organization through the power of conversational analytics.
Users will be able to simply ask questions to their data, as they would in a normal conversation, and be able to gain instantaneous insights presented in highly intuitive visualizations.
Qbo also allows you to build effective dashboards on the go without recreating any presentation decks. That means simply pinning your charts and playing your stories directly in meetings, saving you time to focus more on your narrative & crafting a more impactful takeaway message.
Ready to get started?
Embark on a free 14-day trial and see how Qbo can help your teams build better dashboards and tell better stories today.