6 Minutes

From Static Reports to Augmented Analytics: The Evolution of BI Through the Ages
The Arrival of Visual-Centric BI Platforms
Things started changing with the advent of visual-centric BI platforms. These tools promised an analytics nirvana and great-looking reports. Dashboards created by visual analytics tools allowed the user to click through data selections, filter their way to retrieve useful data snippets. The base for using these visual analytics tools still remained an underlying data warehouse. Creating a data warehouse took a large amount of processing, development time and it was also an expensive project. It took significant efforts to pull together data from disparate systems, clean it and build it into a well-designed data warehouse.


The business managers who needed to use analytics to speed up their work were put off by the time it took to put together a data warehouse. This often led to the adoption of shortcuts in data processing to enable analytics reporting. An intense focus was laid on perfecting the art of visualizing the data and presenting it with pleasing color palettes to highlight actionable insights on a dashboard. The era of interactive dashboards had arrived.
Big Data & Self-Service BI Tools
While the world was busy with dashboards, big data technologies were operationalized. The storage of data was no longer expensive. The world was generating ever-increasing amounts of data. The visualization tools which could easily present a 12-month trend of revenues struggle to visualize a list of 1000 products that are being sold hourly on an online eCommerce platform in 100 geographies. Users who were used to viewing compact, pleasing 12 months trends also expected to view the increasing volumes of data in the same way. This led to a quest for sophisticated visualization widgets which could present the data in innovative ways.
BI tools also accommodated ”in memory” processing of data to significantly speed up the delivery of reports to end-users. This step was included to overcome long query execution times.
These days, a plethora of features are available in BI tools. A vast ocean of analytical needs exists for end-users. These needs range from an ability to email a monthly compliance report to market regulators, from being able to pick the hottest selling item in the retail stores, to check the inventory of pharma components needed to produce the best selling drugs. However, as big data and analytics technologies move forward at lightning speed, it is becoming clear that we are now witnessing the next wave of disruption in BI.
The Next Wave of Disruption in BI: Augmented Analytics
Today, self-service Business Intelligence tools are moving towards becoming more automated and collaborative. This means that end-users no longer need to wait for either IT specialists or data scientists to prepare and process their data. With the help of artificial intelligence, organizations can now leverage augmented analytics tools to serve their BI needs and generate insights.
Combining this with collaborative BI tools which enable individuals within a company to work together on the BI platforms takes the experience one step further.
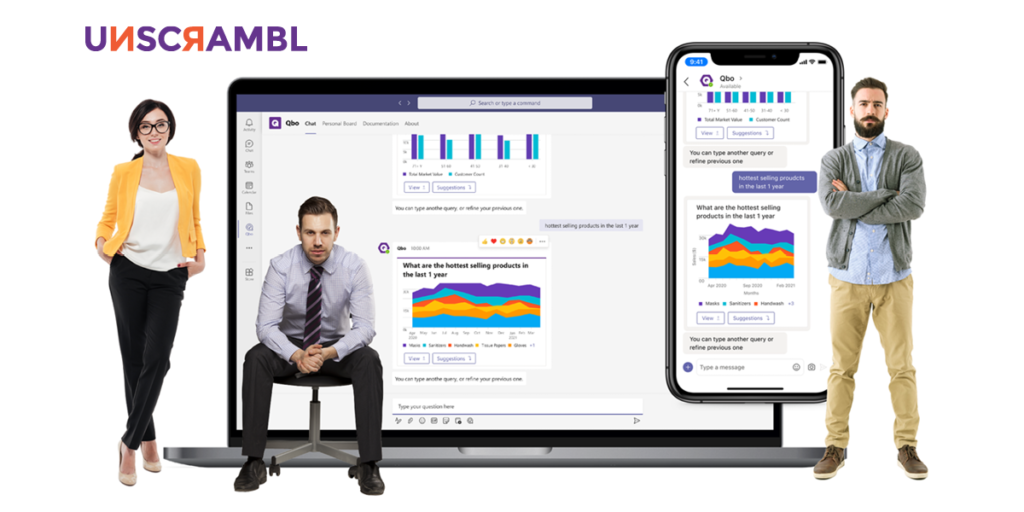
At Unscrambl, we find ourselves at the forefront of this disruption. Explore Qbo and join us on a 14-day free trial where you will be able to access the best that augmented analytics and BI has to offer!
If self-service reporting is one of the desired outcomes of a project, the enforcement of data modeling restrictions like 3rd normal form, strict testing, and deployment process, lead to the system becoming too complex for use by non-technical users. The aim of “self-service” is thus rarely achieved. It takes 8 to 10 days, to bring together all the logic, achieve correct SQL generation and then format the report to the desired formatting for printing. The report has to be tested with data in user acceptance testing (UAT), and then approved for final production environment deployment. All in all, a single report deployment takes up to a whopping 6 to 8 weeks of time with traditional systems.
The Arrival of Visual-Centric BI Platforms
Things started changing with the advent of visual-centric BI platforms. These tools promised an analytics nirvana and great-looking reports. Dashboards created by visual analytics tools allowed the user to click through data selections, filter their way to retrieve useful data snippets. The base for using these visual analytics tools still remained an underlying data warehouse. Creating a data warehouse took a large amount of processing, development time and it was also an expensive project. It took significant efforts to pull together data from disparate systems, clean it and build it into a well-designed data warehouse.
The business managers who needed to use analytics to speed up their work were put off by the time it took to put together a data warehouse. This often led to the adoption of shortcuts in data processing to enable analytics reporting. An intense focus was laid on perfecting the art of visualizing the data and presenting it with pleasing color palettes to highlight actionable insights on a dashboard. The era of interactive dashboards had arrived.
Big Data & Self-Service BI Tools
While the world was busy with dashboards, big data technologies were operationalized. The storage of data was no longer expensive. The world was generating ever-increasing amounts of data. The visualization tools which could easily present a 12-month trend of revenues struggle to visualize a list of 1000 products that are being sold hourly on an online eCommerce platform in 100 geographies. Users who were used to viewing compact, pleasing 12 months trends also expected to view the increasing volumes of data in the same way. This led to a quest for sophisticated visualization widgets which could present the data in innovative ways.
BI tools also accommodated ”in memory” processing of data to significantly speed up the delivery of reports to end-users. This step was included to overcome long query execution times.
These days, a plethora of features are available in BI tools. A vast ocean of analytical needs exists for end-users. These needs range from an ability to email a monthly compliance report to market regulators, from being able to pick the hottest selling item in the retail stores, to check the inventory of pharma components needed to produce the best selling drugs. However, as big data and analytics technologies move forward at lightning speed, it is becoming clear that we are now witnessing the next wave of disruption in BI.
The Next Wave of Disruption in BI: Augmented Analytics
Today, self-service Business Intelligence tools are moving towards becoming more automated and collaborative. This means that end-users no longer need to wait for either IT specialists or data scientists to prepare and process their data. With the help of artificial intelligence, organizations can now leverage augmented analytics tools to serve their BI needs and generate insights.
Combining this with collaborative BI tools which enable individuals within a company to work together on the BI platforms takes the experience one step further.
At Unscrambl, we find ourselves at the forefront of this disruption. Explore Qbo and join us on a 14-day free trial where you will be able to access the best that augmented analytics and BI has to offer!
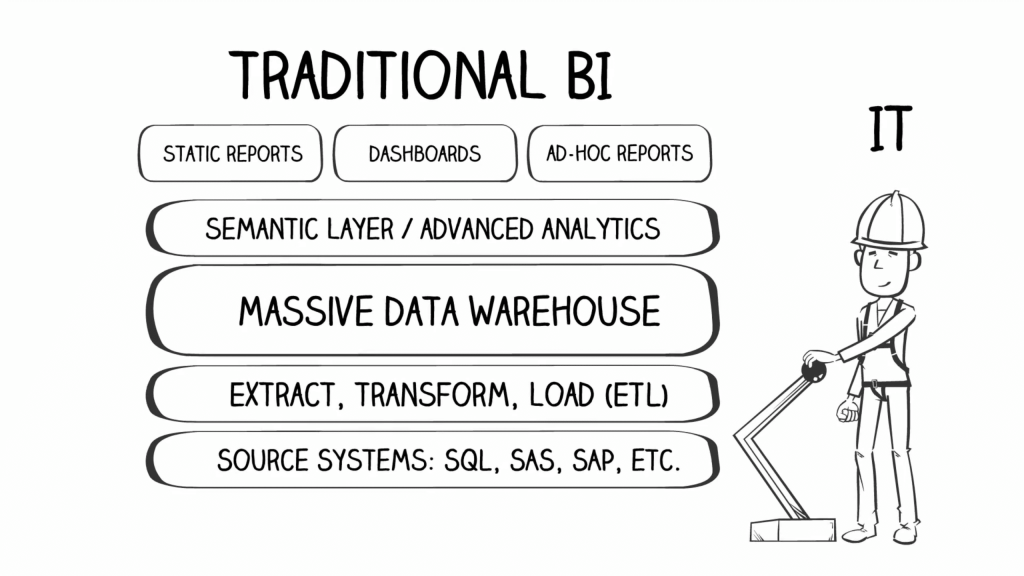
Significant Support from IT Team: Another major issue with traditional BI tools is the fact that they require significant IT background and training for day-to-day operations. A lot of effort is needed to gain proficiency in writing and understanding complicated SQL queries and other complex IT tasks for maintenance and administration of the BI tools. The IT team is thus entrusted with generating and providing BI reports to business users. The entire process relied on the skill level of IT personnel and even simple modifications to reports or the addition of data require days, if not weeks of going through the same lengthy IT lead testing and deployment process.
If self-service reporting is one of the desired outcomes of a project, the enforcement of data modeling restrictions like 3rd normal form, strict testing, and deployment process, lead to the system becoming too complex for use by non-technical users. The aim of “self-service” is thus rarely achieved. It takes 8 to 10 days, to bring together all the logic, achieve correct SQL generation and then format the report to the desired formatting for printing. The report has to be tested with data in user acceptance testing (UAT), and then approved for final production environment deployment. All in all, a single report deployment takes up to a whopping 6 to 8 weeks of time with traditional systems.
The Arrival of Visual-Centric BI Platforms
Things started changing with the advent of visual-centric BI platforms. These tools promised an analytics nirvana and great-looking reports. Dashboards created by visual analytics tools allowed the user to click through data selections, filter their way to retrieve useful data snippets. The base for using these visual analytics tools still remained an underlying data warehouse. Creating a data warehouse took a large amount of processing, development time and it was also an expensive project. It took significant efforts to pull together data from disparate systems, clean it and build it into a well-designed data warehouse.
The business managers who needed to use analytics to speed up their work were put off by the time it took to put together a data warehouse. This often led to the adoption of shortcuts in data processing to enable analytics reporting. An intense focus was laid on perfecting the art of visualizing the data and presenting it with pleasing color palettes to highlight actionable insights on a dashboard. The era of interactive dashboards had arrived.
Big Data & Self-Service BI Tools
While the world was busy with dashboards, big data technologies were operationalized. The storage of data was no longer expensive. The world was generating ever-increasing amounts of data. The visualization tools which could easily present a 12-month trend of revenues struggle to visualize a list of 1000 products that are being sold hourly on an online eCommerce platform in 100 geographies. Users who were used to viewing compact, pleasing 12 months trends also expected to view the increasing volumes of data in the same way. This led to a quest for sophisticated visualization widgets which could present the data in innovative ways.
BI tools also accommodated ”in memory” processing of data to significantly speed up the delivery of reports to end-users. This step was included to overcome long query execution times.
These days, a plethora of features are available in BI tools. A vast ocean of analytical needs exists for end-users. These needs range from an ability to email a monthly compliance report to market regulators, from being able to pick the hottest selling item in the retail stores, to check the inventory of pharma components needed to produce the best selling drugs. However, as big data and analytics technologies move forward at lightning speed, it is becoming clear that we are now witnessing the next wave of disruption in BI.
The Next Wave of Disruption in BI: Augmented Analytics
Today, self-service Business Intelligence tools are moving towards becoming more automated and collaborative. This means that end-users no longer need to wait for either IT specialists or data scientists to prepare and process their data. With the help of artificial intelligence, organizations can now leverage augmented analytics tools to serve their BI needs and generate insights.
Combining this with collaborative BI tools which enable individuals within a company to work together on the BI platforms takes the experience one step further.
At Unscrambl, we find ourselves at the forefront of this disruption. Explore Qbo and join us on a 14-day free trial where you will be able to access the best that augmented analytics and BI has to offer!
Consider our client – a mechanical and electrical parts manufacturer giant in the Aviation space. A typical Business Intelligence or reporting project for a client would be extremely complex. The client, with a traditional data modeling background, would insist on storing data in 3rd normal form, which resulted in a generation of complex SQLs for retrieving analytical reporting results. In this particular case, the aim of this project was to build a set of reports which were sent to industry regulators in a highly regulated industry and business users working in and managing an engineering shop floor. This shop floor was for overhaul and maintenance activities involving millions of machine spare parts.
The maintenance activities tracked metrics like the mean time between failures (MTBF) and mean time between unscheduled removal (MTBUR) for key components used in executing important transport equipment. MTBF and MTBUR are measures that help to compare systems, especially mechanical or electronic systems. Windows-based programs like FoxPro or Visual Basic – which are seldom used these days – were used for keeping track of components, and a system of Online Transaction Processing (OLTP) optimized tables were used for adding the tracking information.
Issues With Traditional Systems
Missing data: Input systems without validations lead to key components information left incomplete in the underlying OLTP tables. The data contained references to component common names but serial numbers and other key information was left blank.
Complicated processes: Updating the fact tables with all the component hierarchy information is often forbidden to maintain the 3rd normal form of the tables. It is necessary to join with transaction tables that log the workshop information, thus forcing left or right outer joins if the results are to be correctly retrieved. This requires using extreme report tuning measures provided by the BI tool.
Time-consuming: The tool used to generate reports is excellent at creating formatted reports and operational reporting. However, it is time-consuming to fit complex SQL queries to achieve specific results. As such, the reporting becomes quite a complicated affair, requiring both an intimate knowledge of underlying systems which populate the data and the skills to ensure specific join conditions are satisfied to achieve the results with the desired accuracy. This complexity makes it almost impossible to hand over the system for self-service reporting by end-users.
Significant Support from IT Team: Another major issue with traditional BI tools is the fact that they require significant IT background and training for day-to-day operations. A lot of effort is needed to gain proficiency in writing and understanding complicated SQL queries and other complex IT tasks for maintenance and administration of the BI tools. The IT team is thus entrusted with generating and providing BI reports to business users. The entire process relied on the skill level of IT personnel and even simple modifications to reports or the addition of data require days, if not weeks of going through the same lengthy IT lead testing and deployment process.
If self-service reporting is one of the desired outcomes of a project, the enforcement of data modeling restrictions like 3rd normal form, strict testing, and deployment process, lead to the system becoming too complex for use by non-technical users. The aim of “self-service” is thus rarely achieved. It takes 8 to 10 days, to bring together all the logic, achieve correct SQL generation and then format the report to the desired formatting for printing. The report has to be tested with data in user acceptance testing (UAT), and then approved for final production environment deployment. All in all, a single report deployment takes up to a whopping 6 to 8 weeks of time with traditional systems.
The Arrival of Visual-Centric BI Platforms
Things started changing with the advent of visual-centric BI platforms. These tools promised an analytics nirvana and great-looking reports. Dashboards created by visual analytics tools allowed the user to click through data selections, filter their way to retrieve useful data snippets. The base for using these visual analytics tools still remained an underlying data warehouse. Creating a data warehouse took a large amount of processing, development time and it was also an expensive project. It took significant efforts to pull together data from disparate systems, clean it and build it into a well-designed data warehouse.
The business managers who needed to use analytics to speed up their work were put off by the time it took to put together a data warehouse. This often led to the adoption of shortcuts in data processing to enable analytics reporting. An intense focus was laid on perfecting the art of visualizing the data and presenting it with pleasing color palettes to highlight actionable insights on a dashboard. The era of interactive dashboards had arrived.
Big Data & Self-Service BI Tools
While the world was busy with dashboards, big data technologies were operationalized. The storage of data was no longer expensive. The world was generating ever-increasing amounts of data. The visualization tools which could easily present a 12-month trend of revenues struggle to visualize a list of 1000 products that are being sold hourly on an online eCommerce platform in 100 geographies. Users who were used to viewing compact, pleasing 12 months trends also expected to view the increasing volumes of data in the same way. This led to a quest for sophisticated visualization widgets which could present the data in innovative ways.
BI tools also accommodated ”in memory” processing of data to significantly speed up the delivery of reports to end-users. This step was included to overcome long query execution times.
These days, a plethora of features are available in BI tools. A vast ocean of analytical needs exists for end-users. These needs range from an ability to email a monthly compliance report to market regulators, from being able to pick the hottest selling item in the retail stores, to check the inventory of pharma components needed to produce the best selling drugs. However, as big data and analytics technologies move forward at lightning speed, it is becoming clear that we are now witnessing the next wave of disruption in BI.
The Next Wave of Disruption in BI: Augmented Analytics
Today, self-service Business Intelligence tools are moving towards becoming more automated and collaborative. This means that end-users no longer need to wait for either IT specialists or data scientists to prepare and process their data. With the help of artificial intelligence, organizations can now leverage augmented analytics tools to serve their BI needs and generate insights.
Combining this with collaborative BI tools which enable individuals within a company to work together on the BI platforms takes the experience one step further.
At Unscrambl, we find ourselves at the forefront of this disruption. Explore Qbo and join us on a 14-day free trial where you will be able to access the best that augmented analytics and BI has to offer!
Around 50 to 70 years ago, the term “business intelligence” or “BI” was not at all prominent. The truth of the matter is that Business Intelligence as we know it today was difficult to figure out – it took years of development in computing and the arrival of the World Wide Web for BI to show its real powers.
As companies in the current business landscape start exploring and adopting Business Intelligence tools, the real challenge for them is to find out if they have what it takes to do BI because the first step to learning how to use a BI tool and gain insights from it is understanding how what BI is and how it has evolved over the ages.
The Early Days of BI – Our Experience From Manufacturing
Put simply, BI comprises all the strategies that a company uses to analyze its data, understand business information, and make effective decisions. A BI tool enables a company to acquire and store raw data from various sources – whether sales or customer data – and process it into valuable information.
The initial period of a boom in the data warehousing and business intelligence industry was an exciting, yet complicated time.
Consider our client – a mechanical and electrical parts manufacturer giant in the Aviation space. A typical Business Intelligence or reporting project for a client would be extremely complex. The client, with a traditional data modeling background, would insist on storing data in 3rd normal form, which resulted in a generation of complex SQLs for retrieving analytical reporting results. In this particular case, the aim of this project was to build a set of reports which were sent to industry regulators in a highly regulated industry and business users working in and managing an engineering shop floor. This shop floor was for overhaul and maintenance activities involving millions of machine spare parts.
The maintenance activities tracked metrics like the mean time between failures (MTBF) and mean time between unscheduled removal (MTBUR) for key components used in executing important transport equipment. MTBF and MTBUR are measures that help to compare systems, especially mechanical or electronic systems. Windows-based programs like FoxPro or Visual Basic – which are seldom used these days – were used for keeping track of components, and a system of Online Transaction Processing (OLTP) optimized tables were used for adding the tracking information.
Issues With Traditional Systems
Missing data: Input systems without validations lead to key components information left incomplete in the underlying OLTP tables. The data contained references to component common names but serial numbers and other key information was left blank.
Complicated processes: Updating the fact tables with all the component hierarchy information is often forbidden to maintain the 3rd normal form of the tables. It is necessary to join with transaction tables that log the workshop information, thus forcing left or right outer joins if the results are to be correctly retrieved. This requires using extreme report tuning measures provided by the BI tool.
Time-consuming: The tool used to generate reports is excellent at creating formatted reports and operational reporting. However, it is time-consuming to fit complex SQL queries to achieve specific results. As such, the reporting becomes quite a complicated affair, requiring both an intimate knowledge of underlying systems which populate the data and the skills to ensure specific join conditions are satisfied to achieve the results with the desired accuracy. This complexity makes it almost impossible to hand over the system for self-service reporting by end-users.
Significant Support from IT Team: Another major issue with traditional BI tools is the fact that they require significant IT background and training for day-to-day operations. A lot of effort is needed to gain proficiency in writing and understanding complicated SQL queries and other complex IT tasks for maintenance and administration of the BI tools. The IT team is thus entrusted with generating and providing BI reports to business users. The entire process relied on the skill level of IT personnel and even simple modifications to reports or the addition of data require days, if not weeks of going through the same lengthy IT lead testing and deployment process.
If self-service reporting is one of the desired outcomes of a project, the enforcement of data modeling restrictions like 3rd normal form, strict testing, and deployment process, lead to the system becoming too complex for use by non-technical users. The aim of “self-service” is thus rarely achieved. It takes 8 to 10 days, to bring together all the logic, achieve correct SQL generation and then format the report to the desired formatting for printing. The report has to be tested with data in user acceptance testing (UAT), and then approved for final production environment deployment. All in all, a single report deployment takes up to a whopping 6 to 8 weeks of time with traditional systems.
The Arrival of Visual-Centric BI Platforms
Things started changing with the advent of visual-centric BI platforms. These tools promised an analytics nirvana and great-looking reports. Dashboards created by visual analytics tools allowed the user to click through data selections, filter their way to retrieve useful data snippets. The base for using these visual analytics tools still remained an underlying data warehouse. Creating a data warehouse took a large amount of processing, development time and it was also an expensive project. It took significant efforts to pull together data from disparate systems, clean it and build it into a well-designed data warehouse.
The business managers who needed to use analytics to speed up their work were put off by the time it took to put together a data warehouse. This often led to the adoption of shortcuts in data processing to enable analytics reporting. An intense focus was laid on perfecting the art of visualizing the data and presenting it with pleasing color palettes to highlight actionable insights on a dashboard. The era of interactive dashboards had arrived.
Big Data & Self-Service BI Tools
While the world was busy with dashboards, big data technologies were operationalized. The storage of data was no longer expensive. The world was generating ever-increasing amounts of data. The visualization tools which could easily present a 12-month trend of revenues struggle to visualize a list of 1000 products that are being sold hourly on an online eCommerce platform in 100 geographies. Users who were used to viewing compact, pleasing 12 months trends also expected to view the increasing volumes of data in the same way. This led to a quest for sophisticated visualization widgets which could present the data in innovative ways.
BI tools also accommodated ”in memory” processing of data to significantly speed up the delivery of reports to end-users. This step was included to overcome long query execution times.
These days, a plethora of features are available in BI tools. A vast ocean of analytical needs exists for end-users. These needs range from an ability to email a monthly compliance report to market regulators, from being able to pick the hottest selling item in the retail stores, to check the inventory of pharma components needed to produce the best selling drugs. However, as big data and analytics technologies move forward at lightning speed, it is becoming clear that we are now witnessing the next wave of disruption in BI.
The Next Wave of Disruption in BI: Augmented Analytics
Today, self-service Business Intelligence tools are moving towards becoming more automated and collaborative. This means that end-users no longer need to wait for either IT specialists or data scientists to prepare and process their data. With the help of artificial intelligence, organizations can now leverage augmented analytics tools to serve their BI needs and generate insights.
Combining this with collaborative BI tools which enable individuals within a company to work together on the BI platforms takes the experience one step further.
At Unscrambl, we find ourselves at the forefront of this disruption. Explore Qbo and join us on a 14-day free trial where you will be able to access the best that augmented analytics and BI has to offer!